A tour of the UI
Sixteen screens, embedded in the binary, and a seventeenth that appears only under the Kubernetes operator. What each one answers, and the one thing on it worth knowing before you trust it.
Overview — is it healthy, and what has it been doing
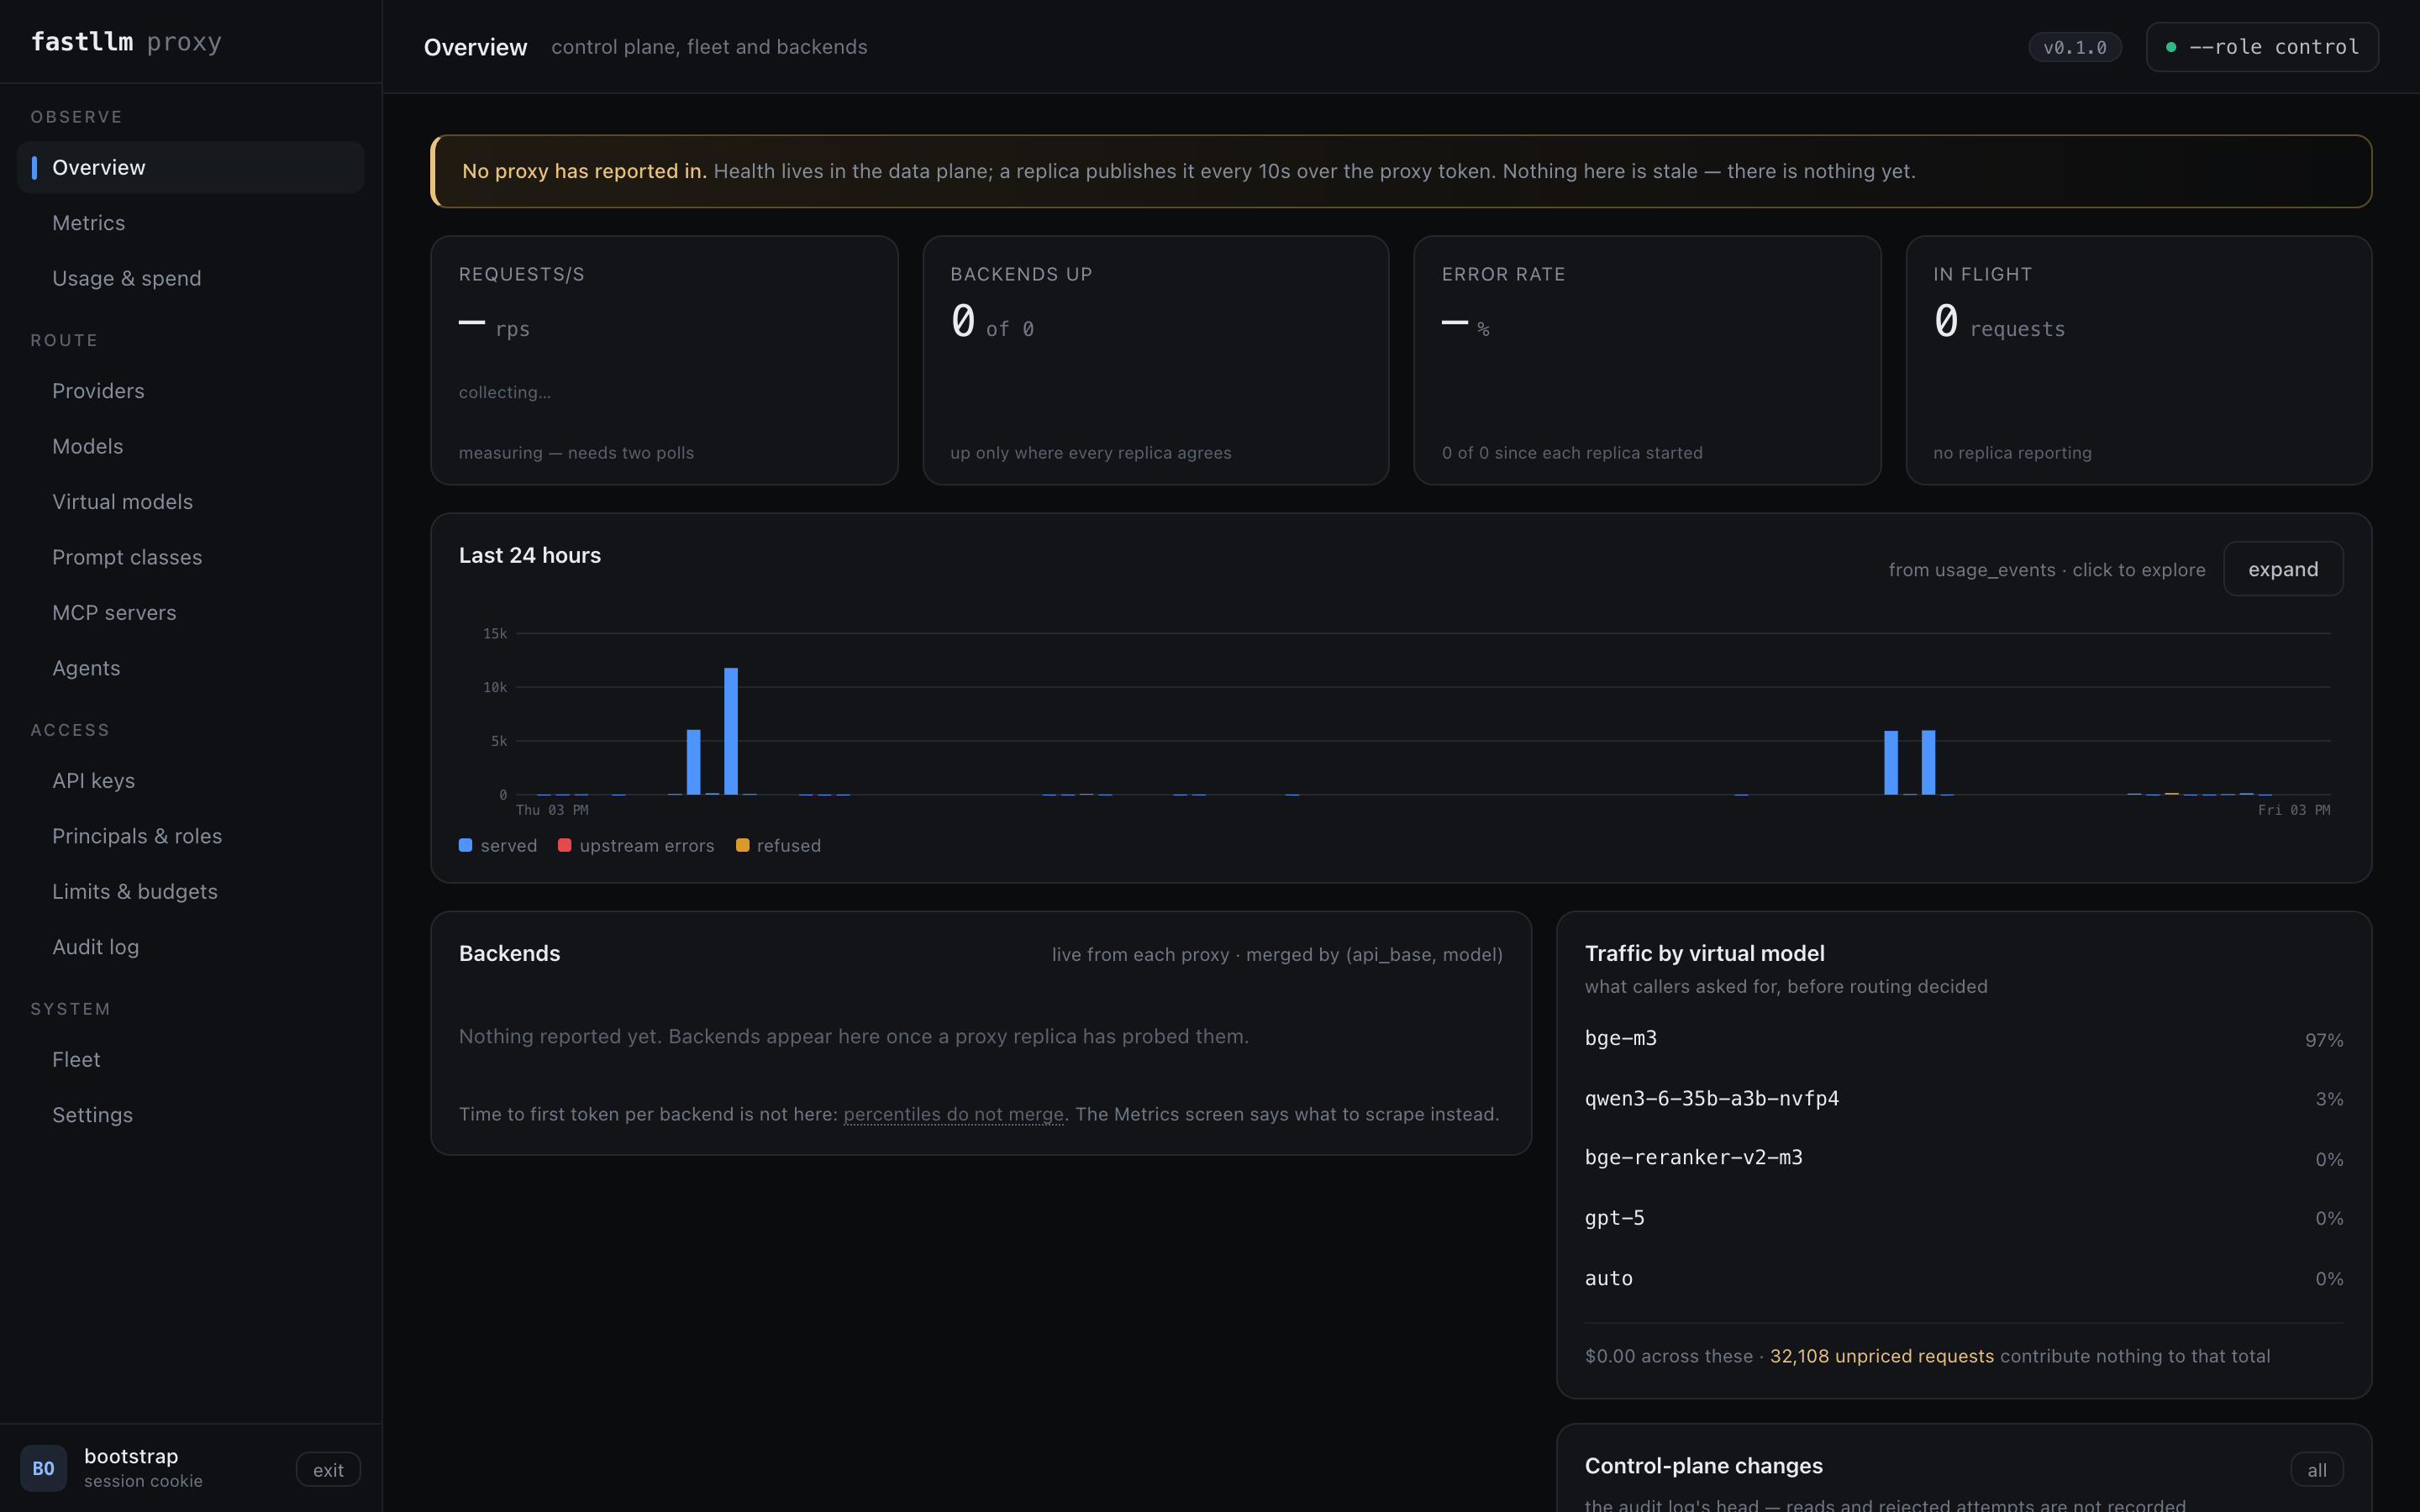
The four tiles are measured live by the page. The chart underneath is read from the database, so it survives a reload and answers "was it like this an hour ago" — a question the tiles cannot.
Backends is per replica and never merged. If one replica reports a backend down and the others do not, that is a partition rather than a dead backend, and averaging them together would delete the only symptom.
Click the chart for the drill-down:
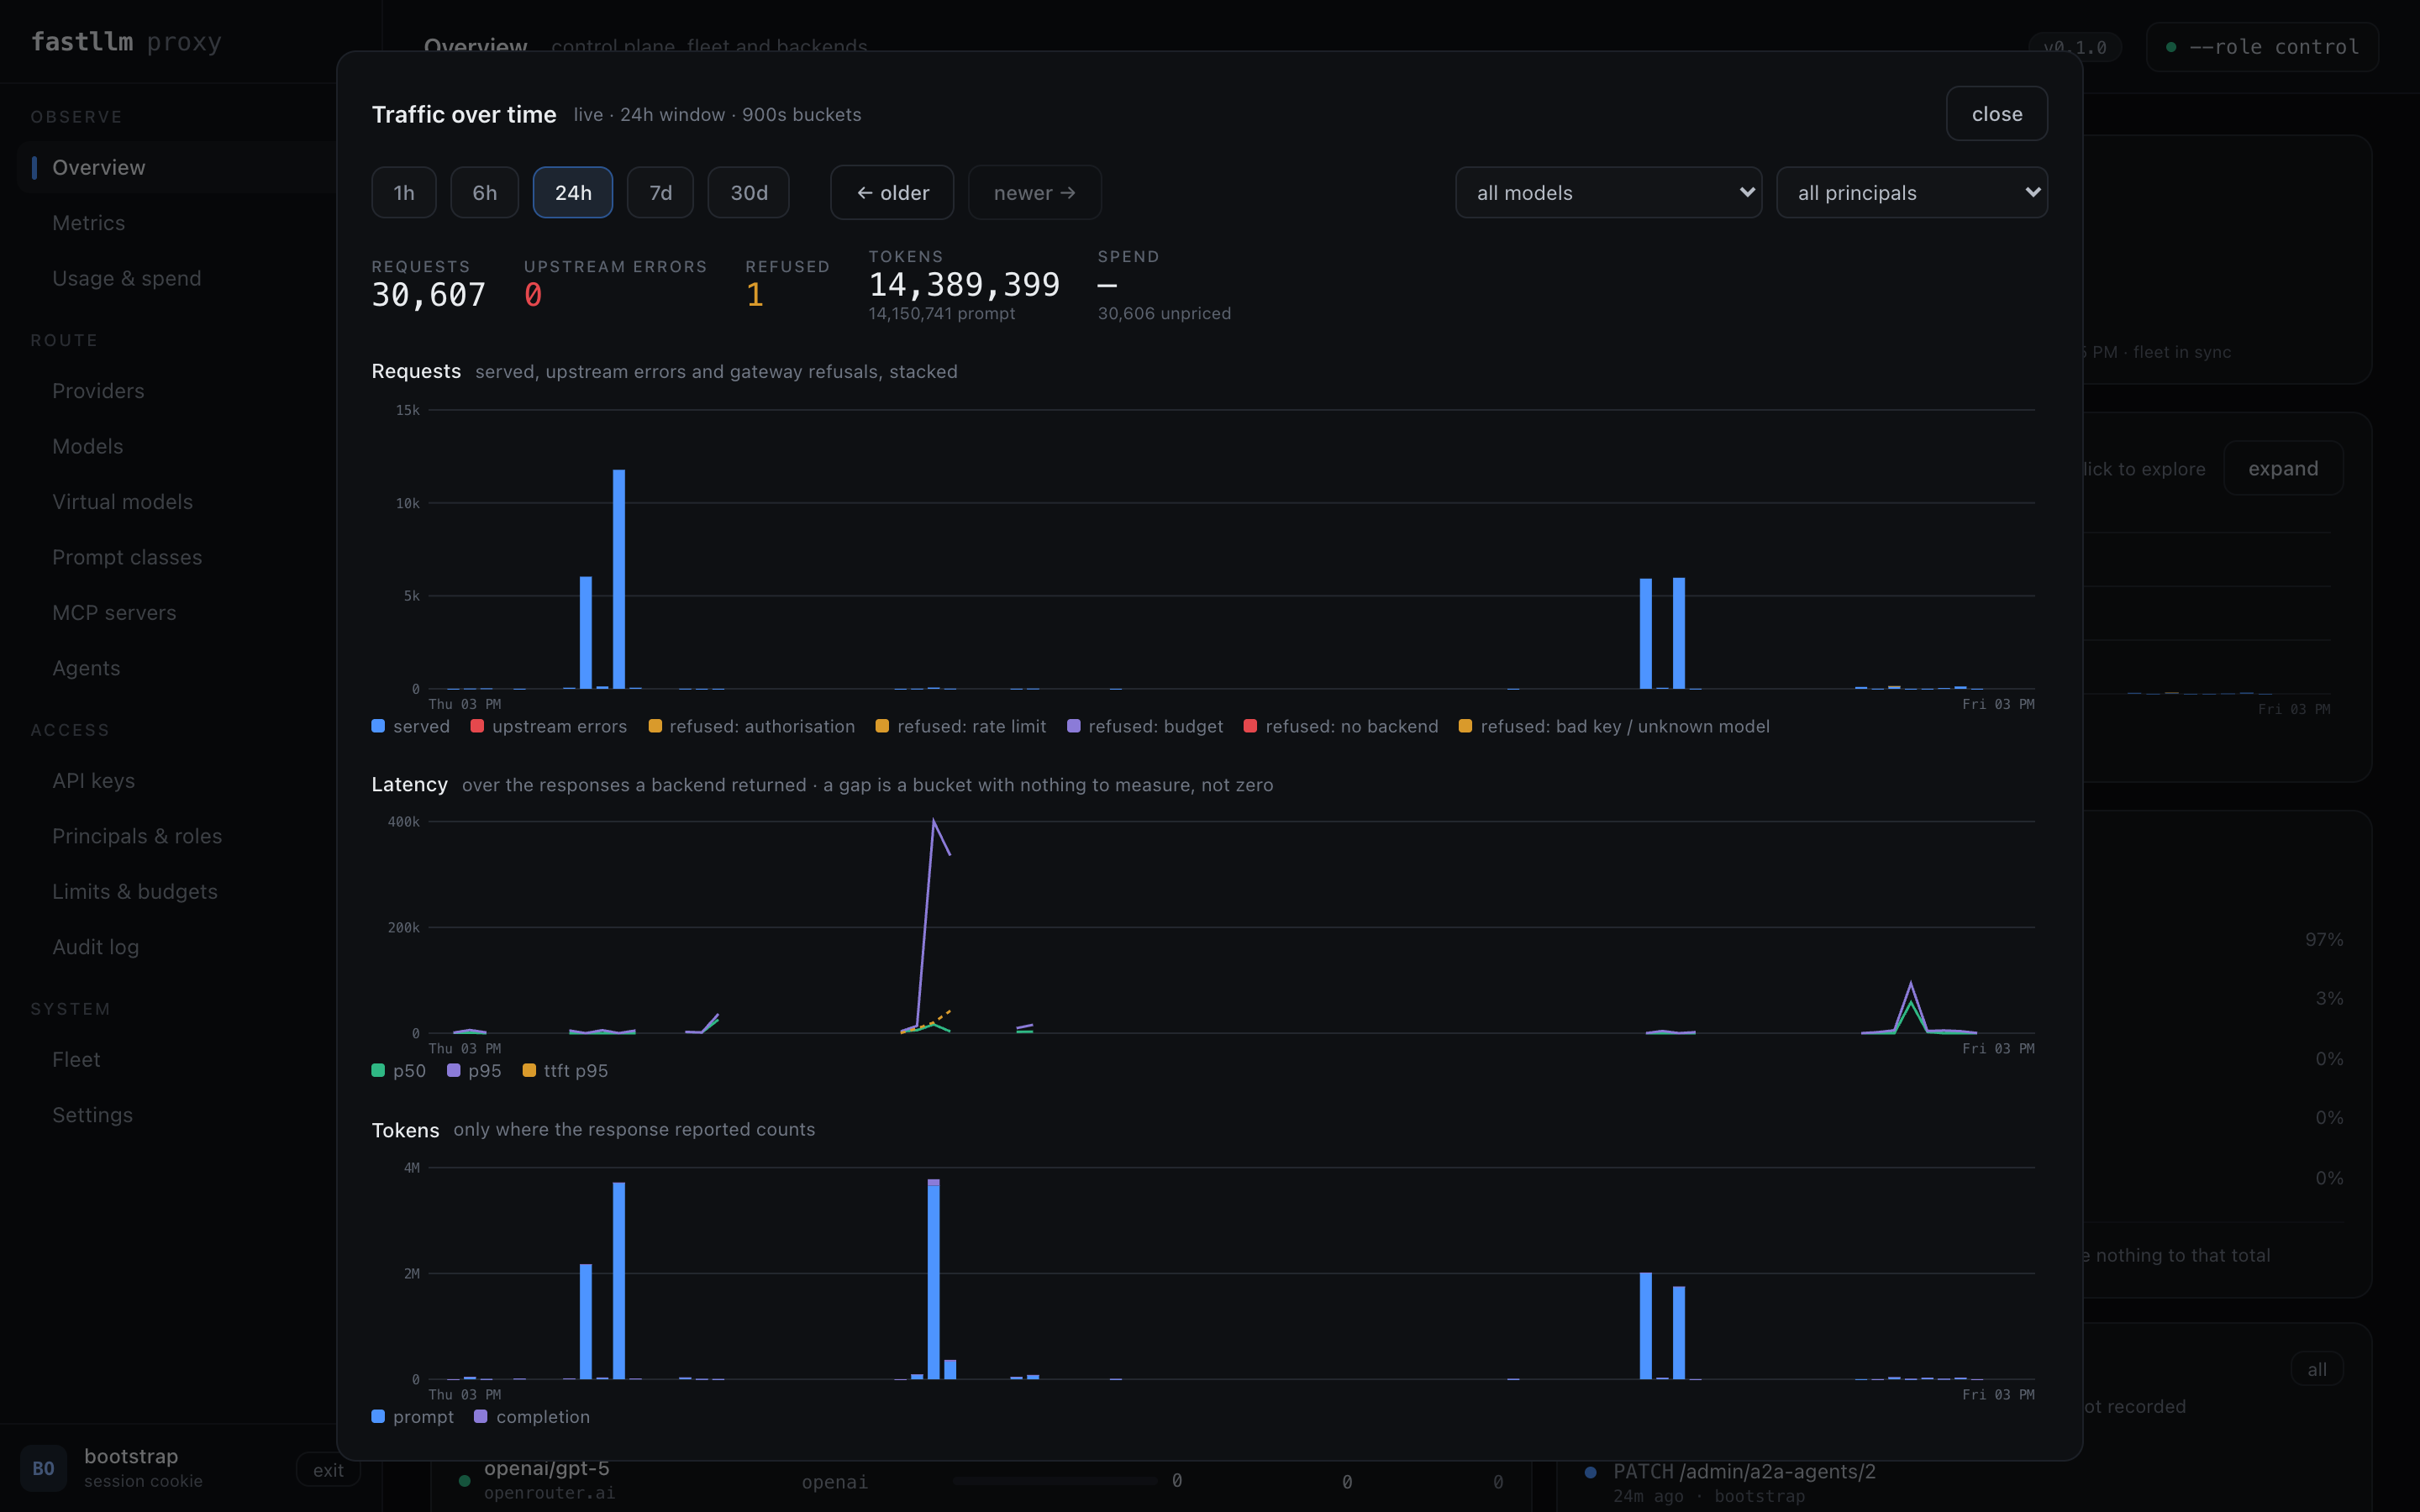
Five ranges, pan backwards through history, filter by model or principal. Requests are stacked as served / upstream errors / refusals-by-kind, because a caller stopped by a budget and a backend that fell over need different people to do different things. A gap in the latency line is a bucket with nothing to measure — not zero.
Metrics — what is happening right now
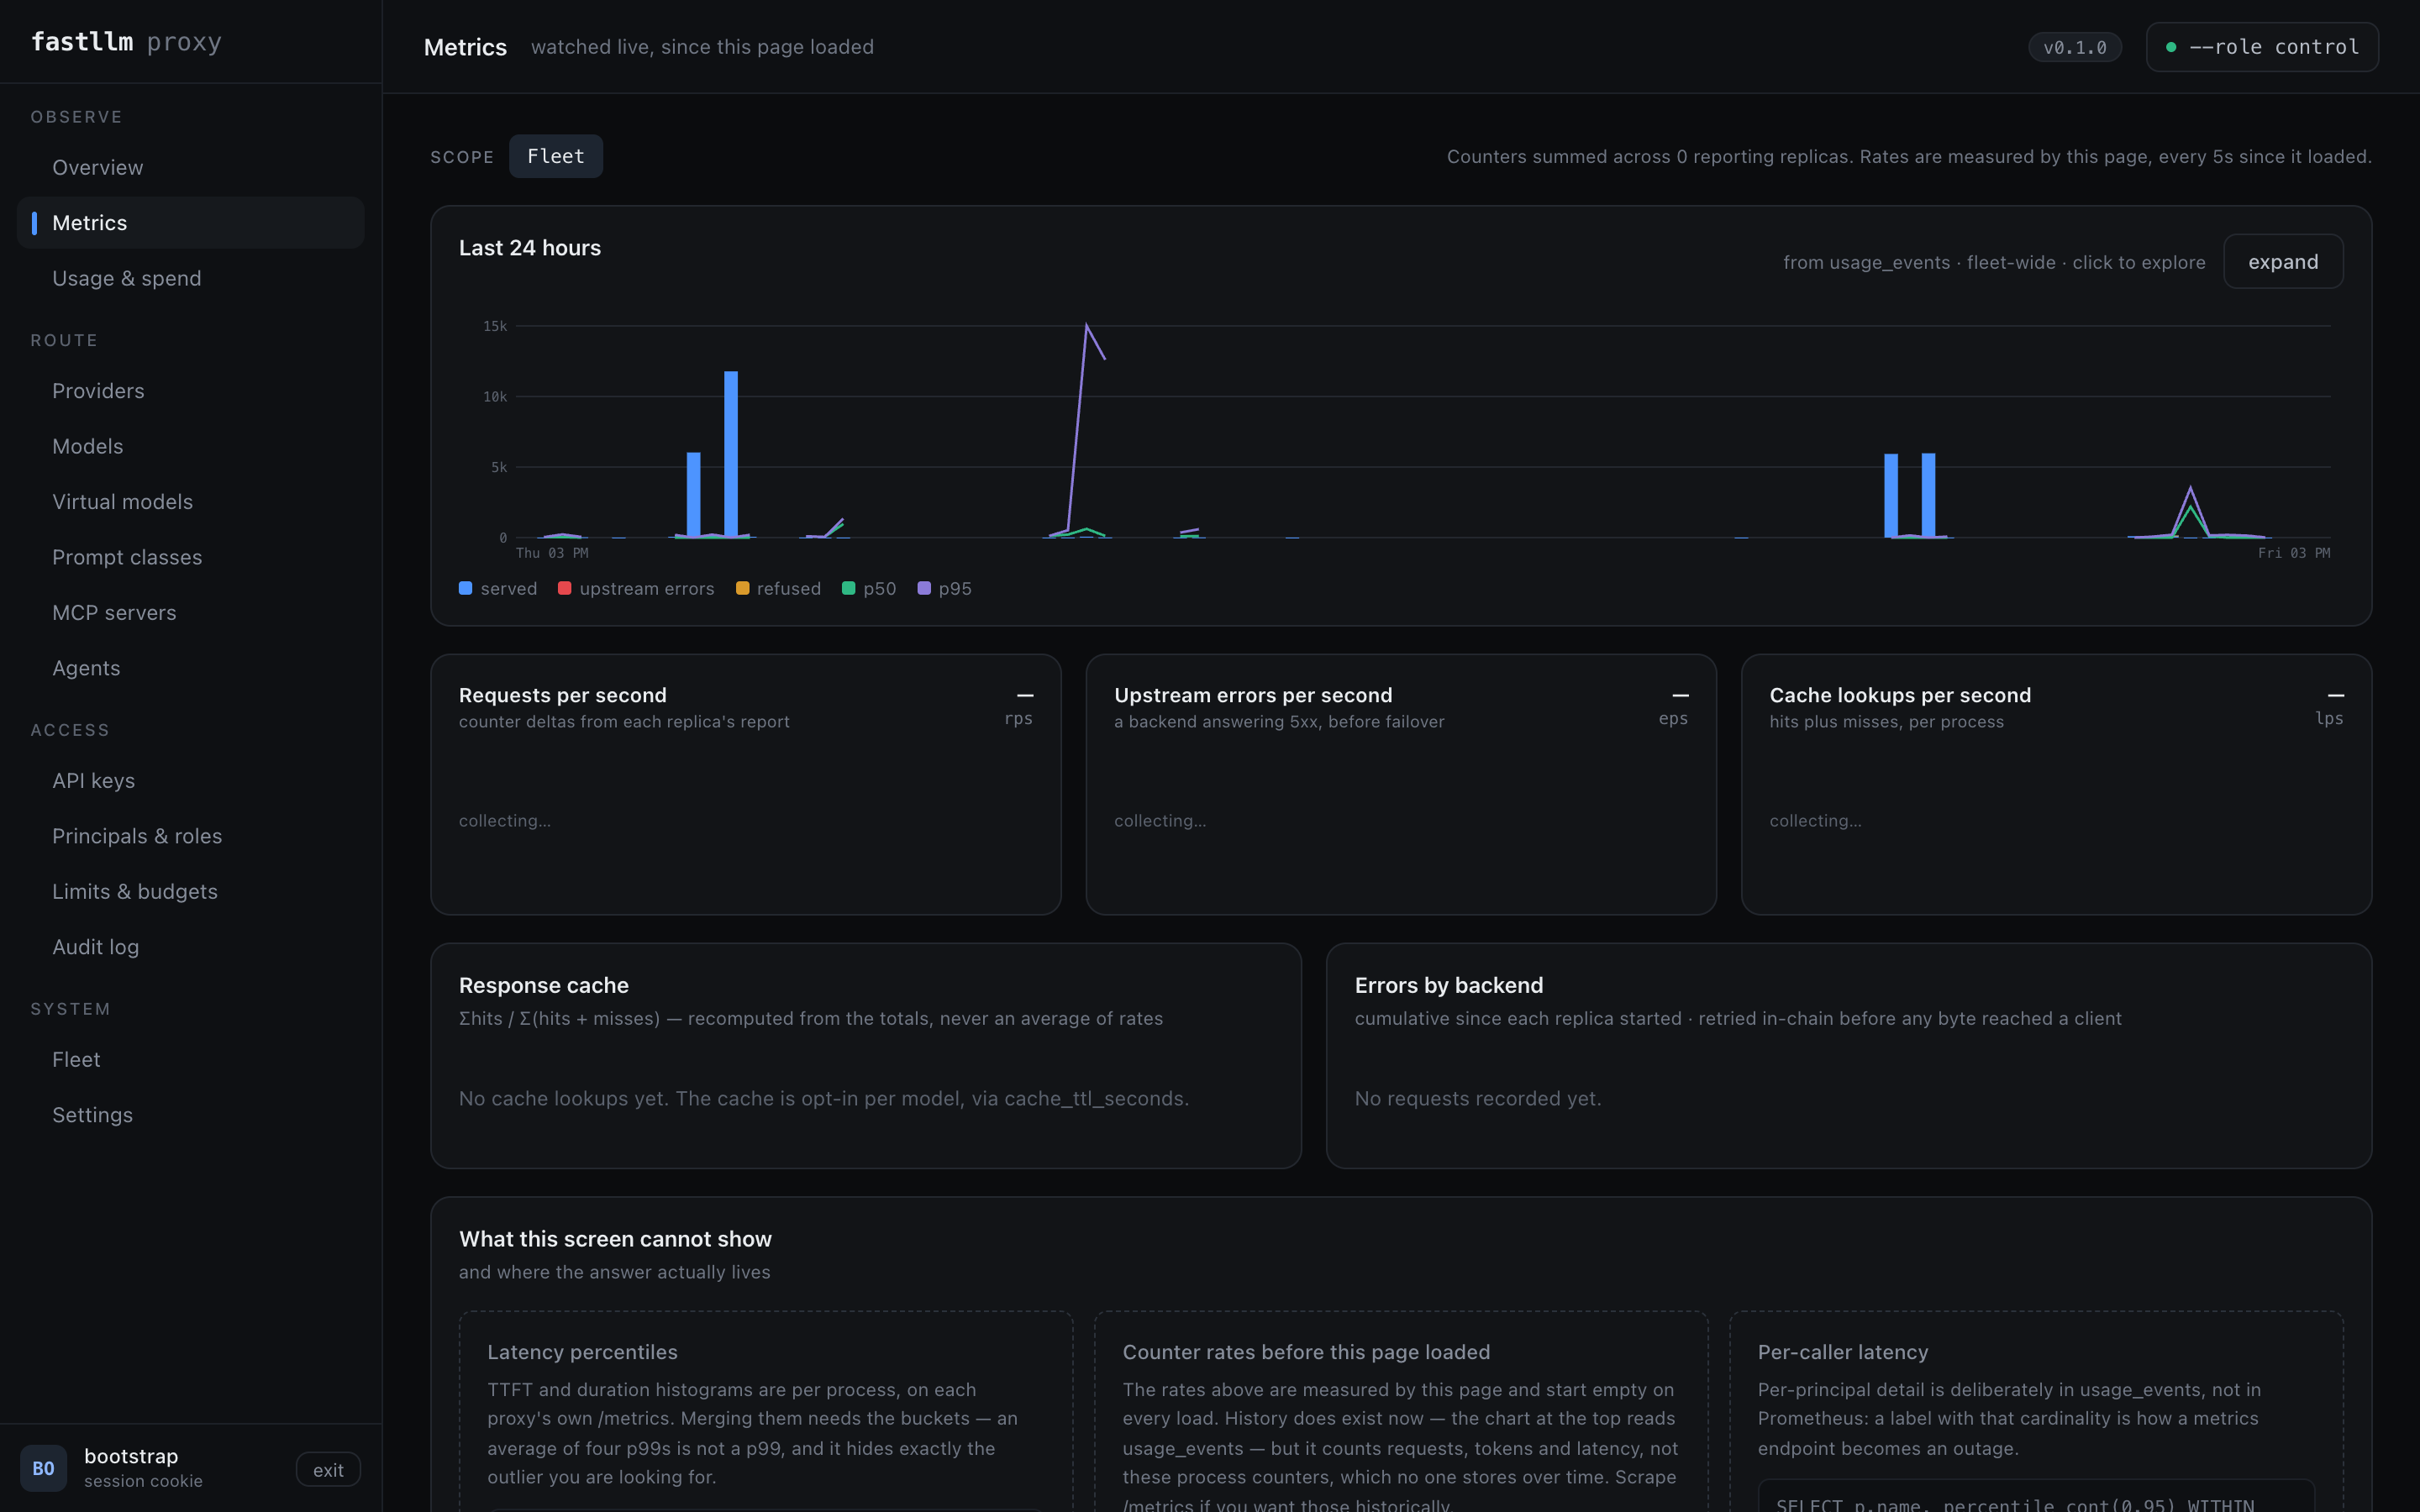
Rates measured by the page since it loaded, scoped to the fleet or to one replica. Percentiles are shown per replica and never merged: the average of four p99s is not a p99, and the screen says so rather than quietly averaging.
Usage & spend — who used what, and what it cost
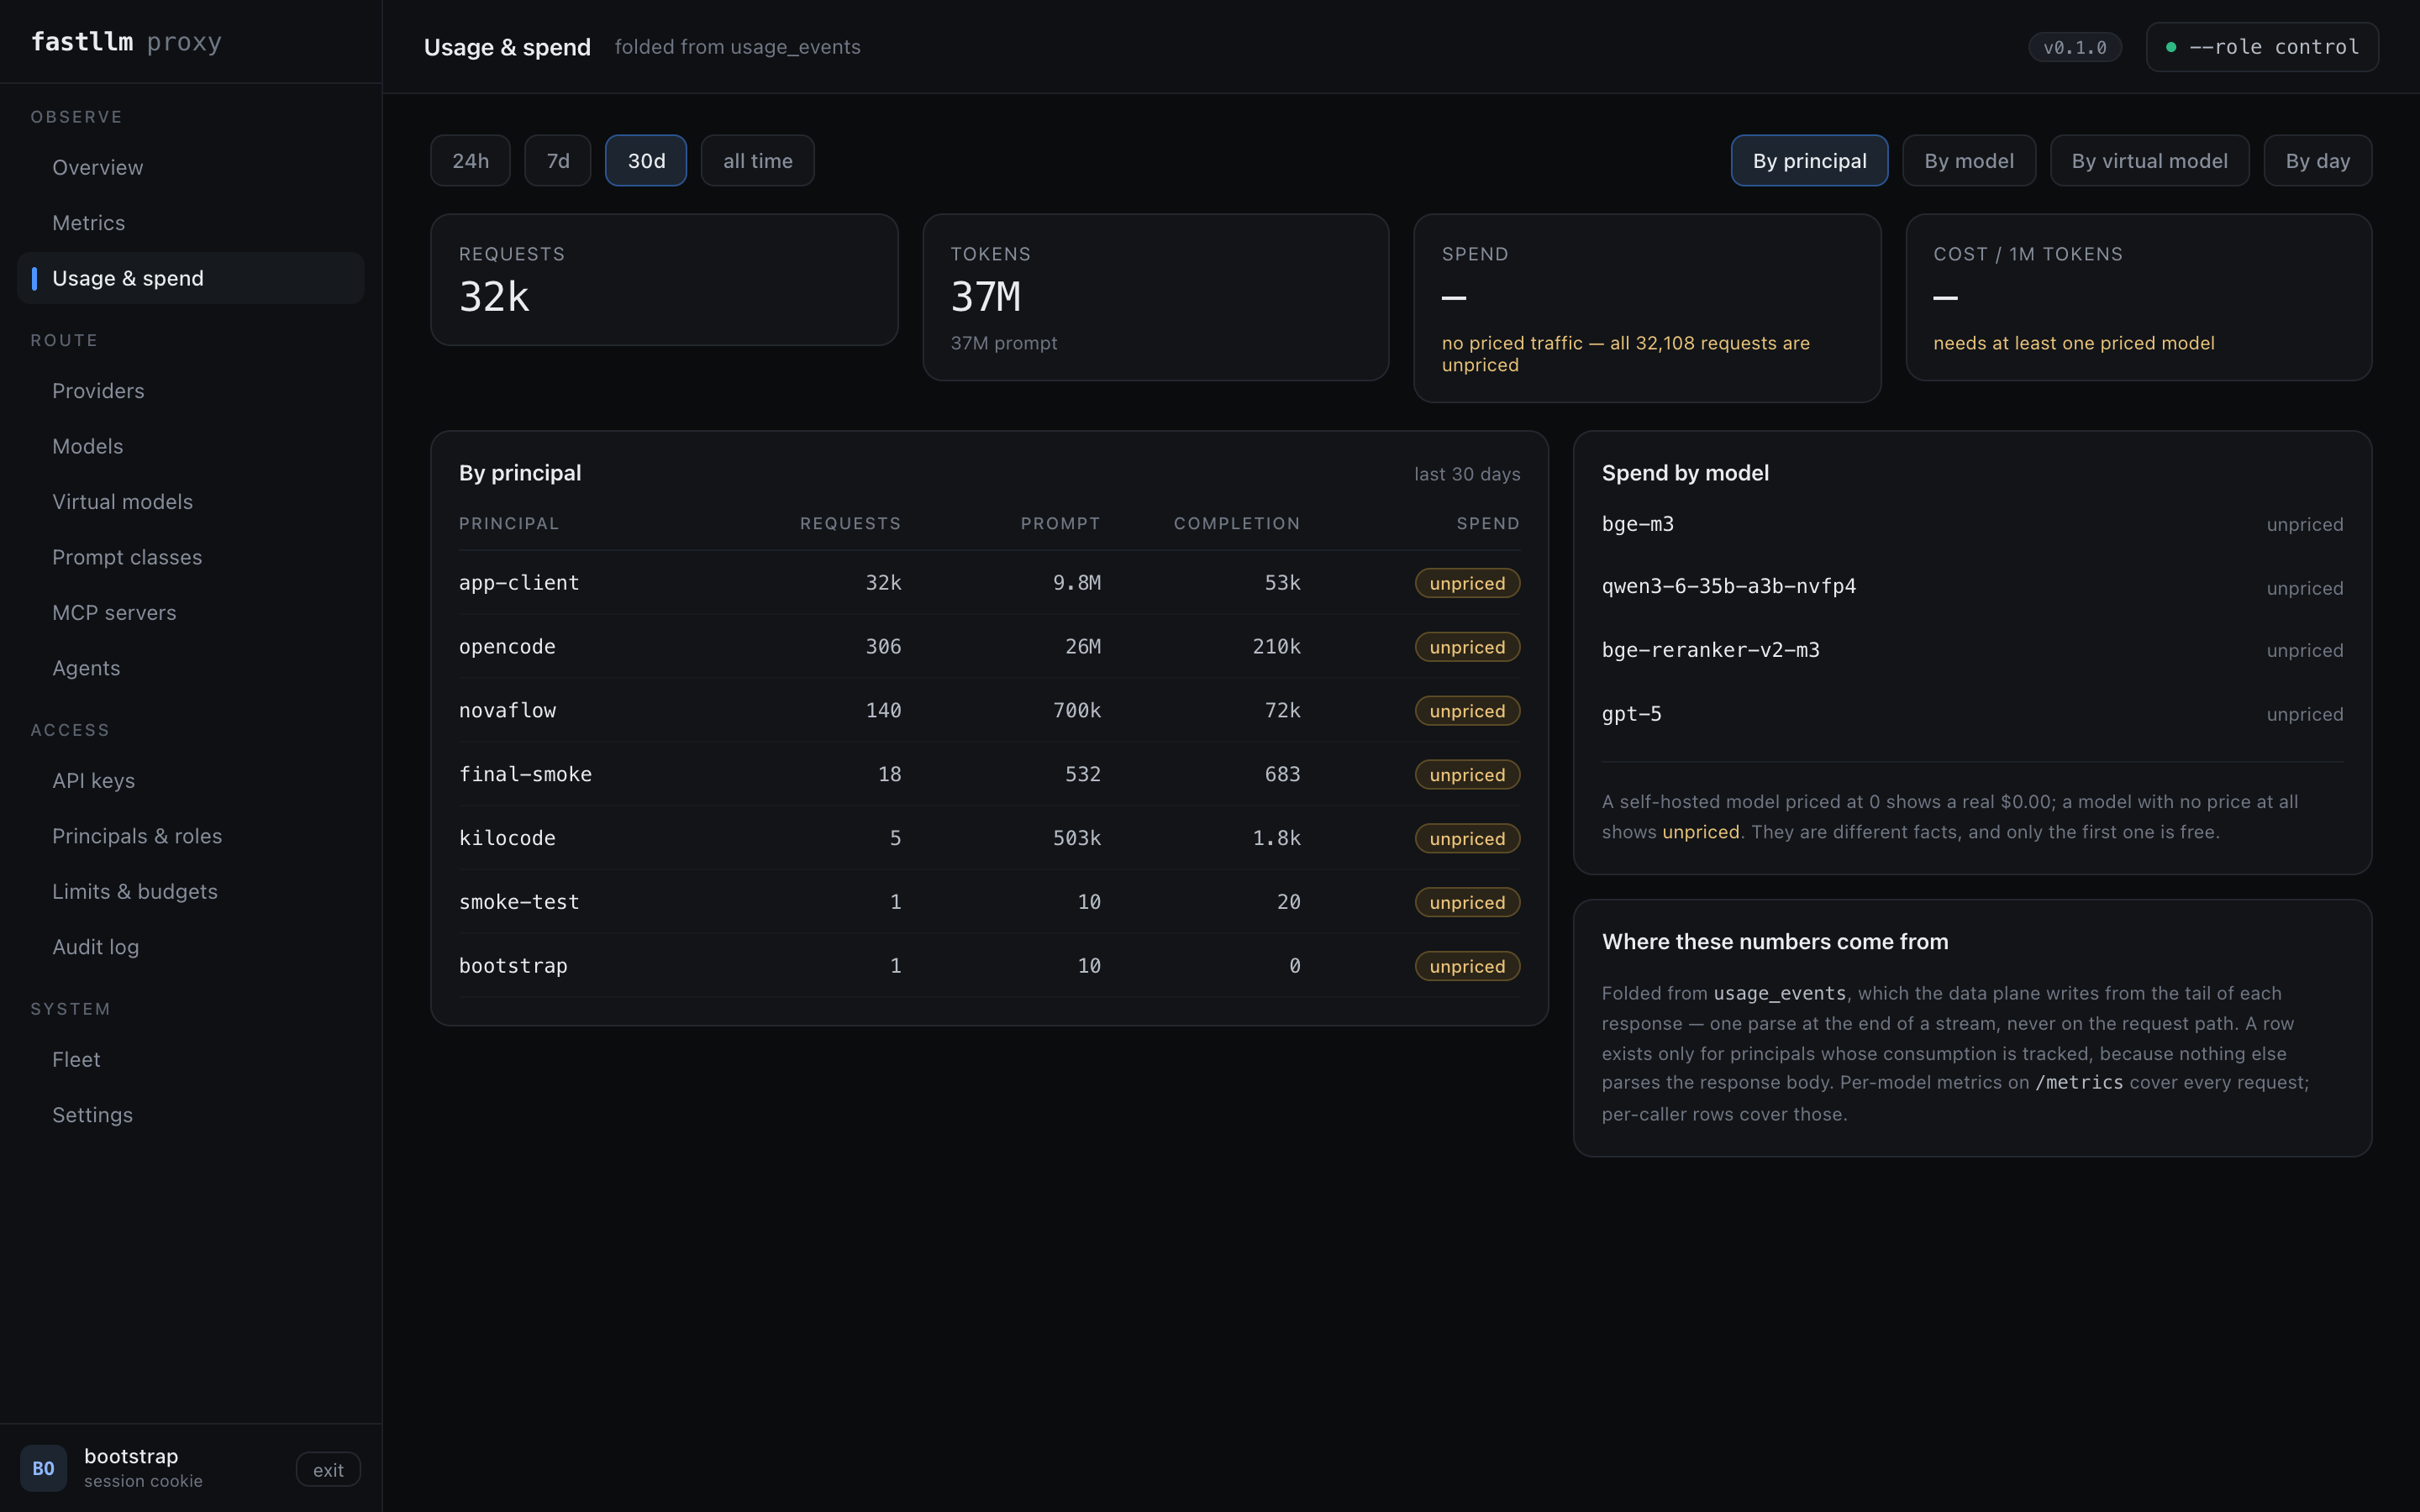
Folded from usage_events, one row per request. A model with no price
contributes nothing to spend and is counted as unpriced rather than as zero,
so a spend figure never quietly understates.
Model pools — one model, the providers you choose
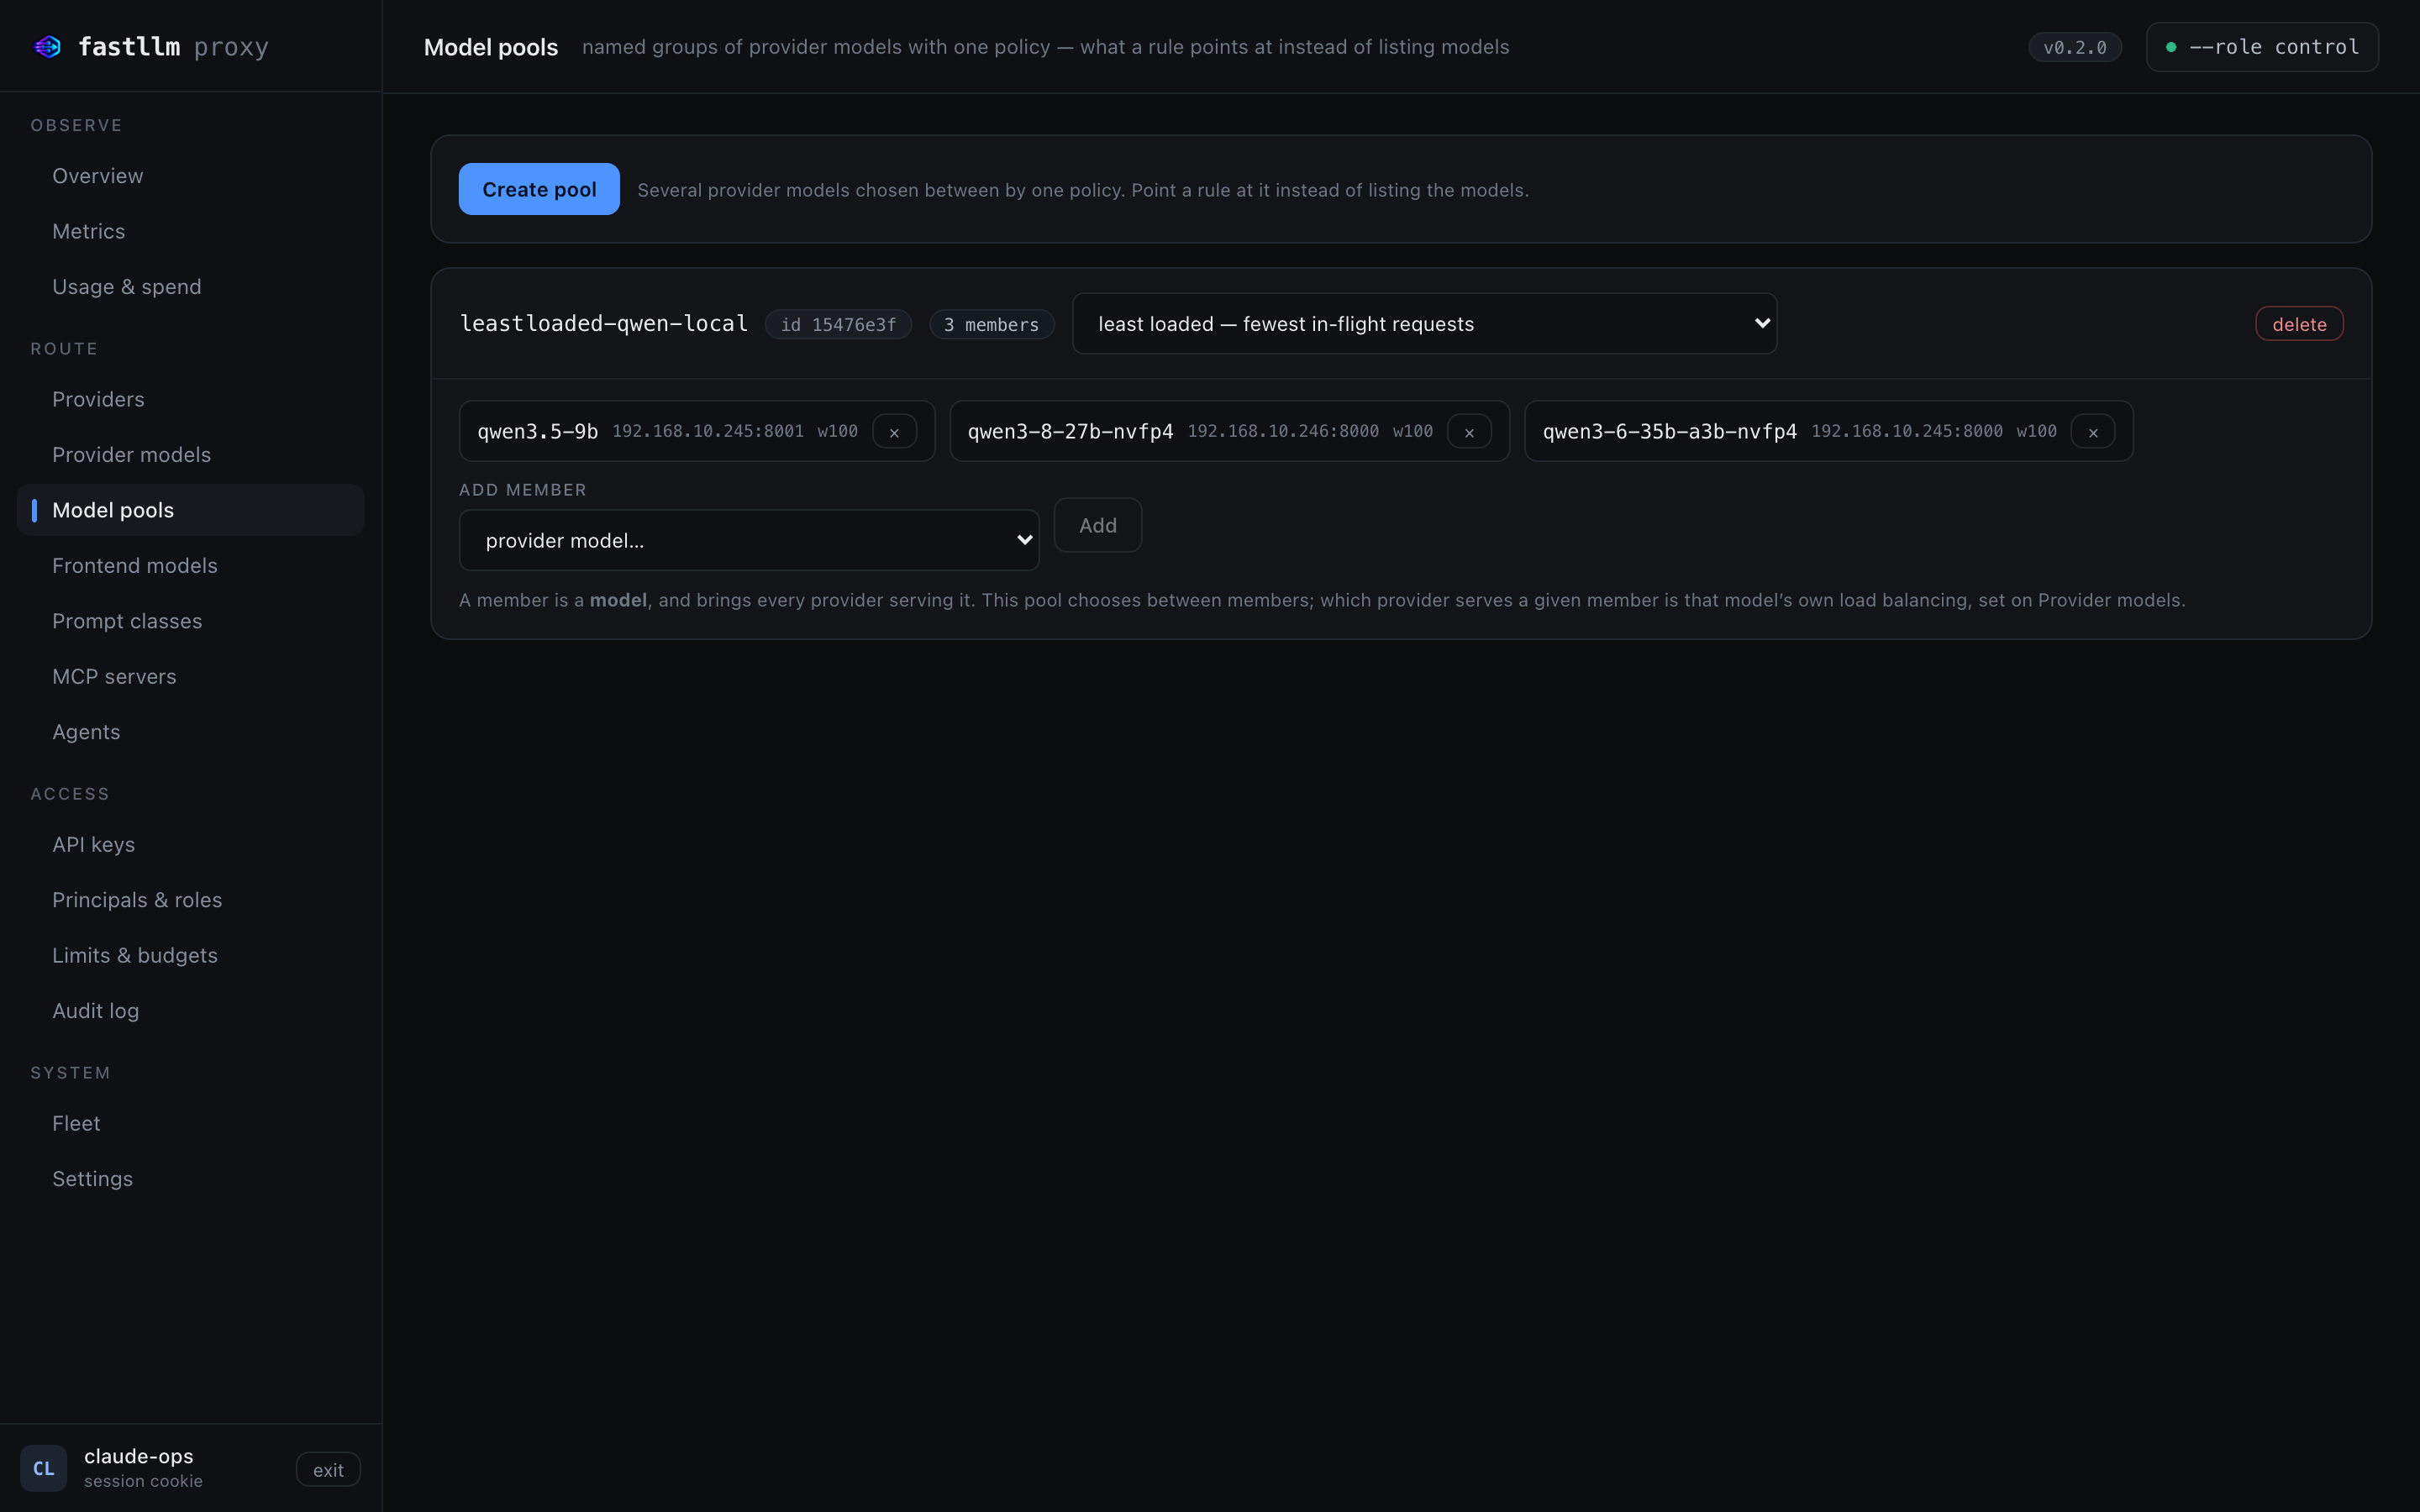
A pool is one model, a chosen subset of the providers serving it, and the policy that picks between them per request — least-loaded, fastest, prefix-affinity, or a weighted split. Choose the model first and its providers are listed one row each, so a pool can balance across two of the three machines serving a model and leave the third alone.
Such a pool is published as a routable model of its own, carrying exactly the ticked attachments and the pool's policy. That is what makes the subset mean anything at dispatch, and it leaves the model itself untouched: it still carries every provider, so everything else routing through it is unaffected.
Frontend model rules choose a pool the same way they choose a single model, and the same model can sit in several pools under different policies.
Cheapest is deliberately not a policy here: choosing on price is a routing decision made before a target is picked, not a way of balancing within one.
Usage rows for a pool record the pool's name as the model, because the pool is what served the request; the exact backend is on the row either way.
Frontend models — one name, many targets
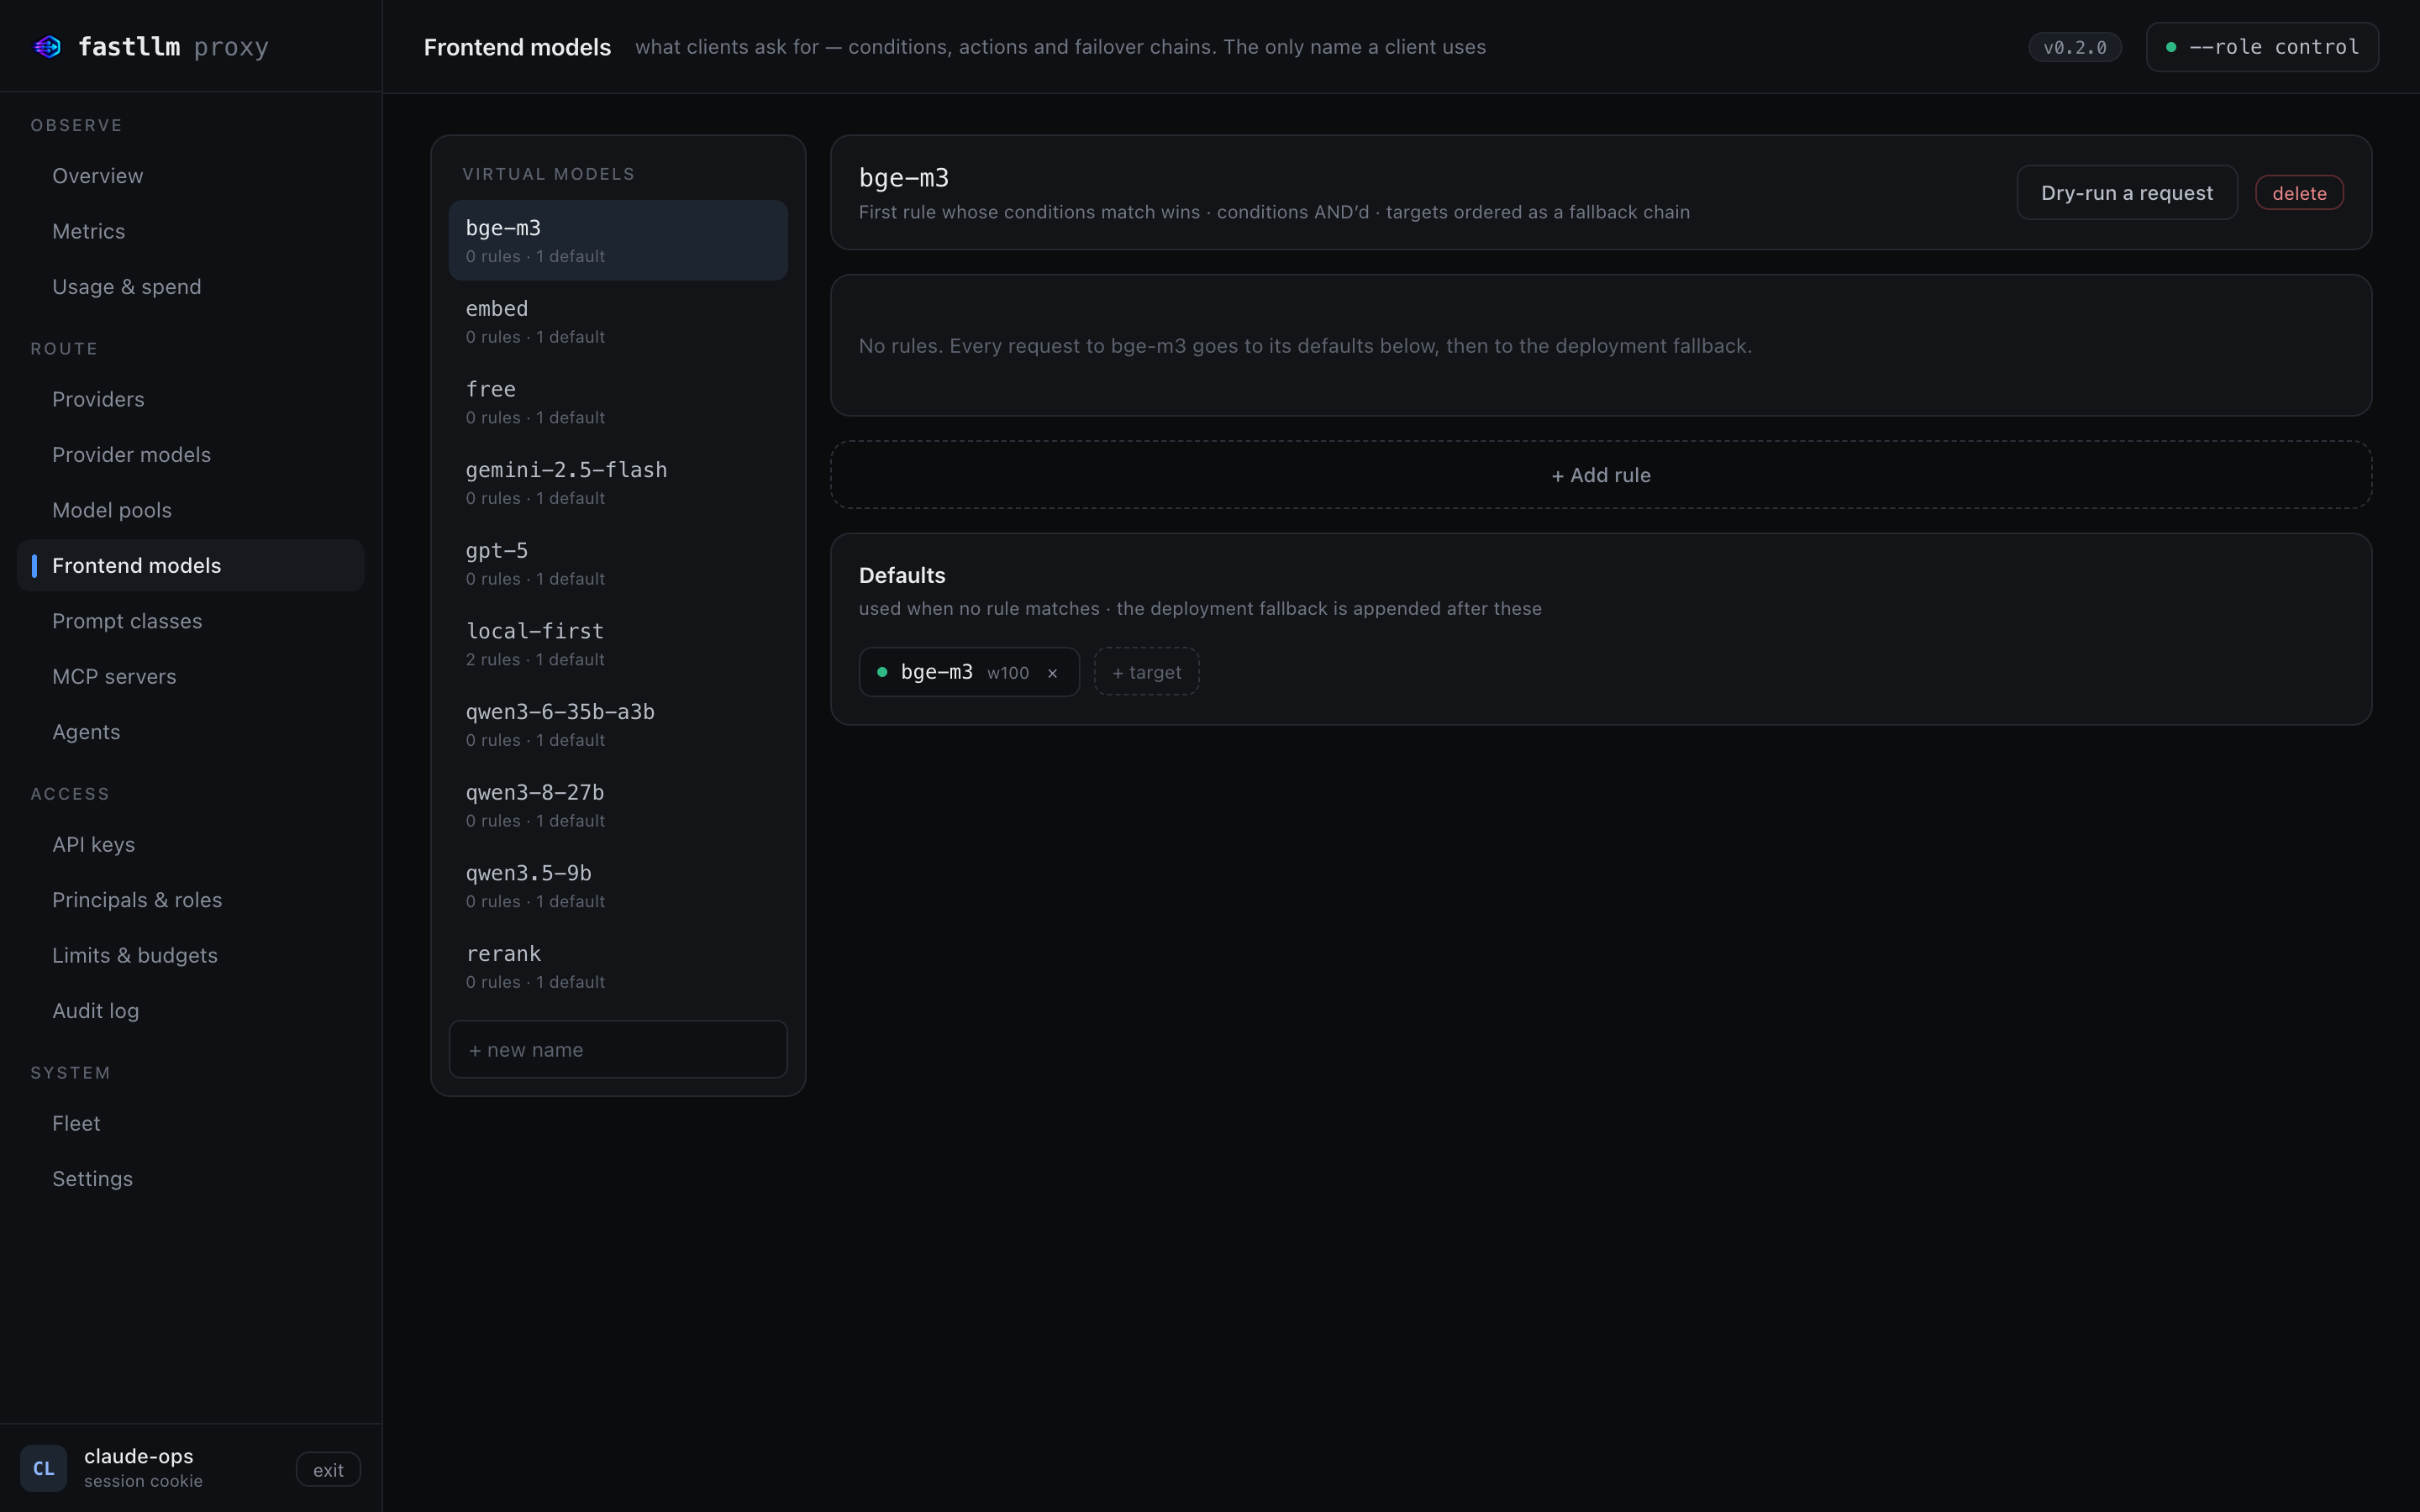
A client-facing name with ordered rules. The first rule whose conditions match wins; targets are weighted and ordered, so one rule is both a split and a failover chain. Conditions can be principal, role, prompt size, requested generation, streaming, headers, budget consumption, time of day, or semantic class.
Dry-run answers which rule would decide, and what the chain resolves to, without dispatching anything.
Prompt classes — routing on what the prompt is about
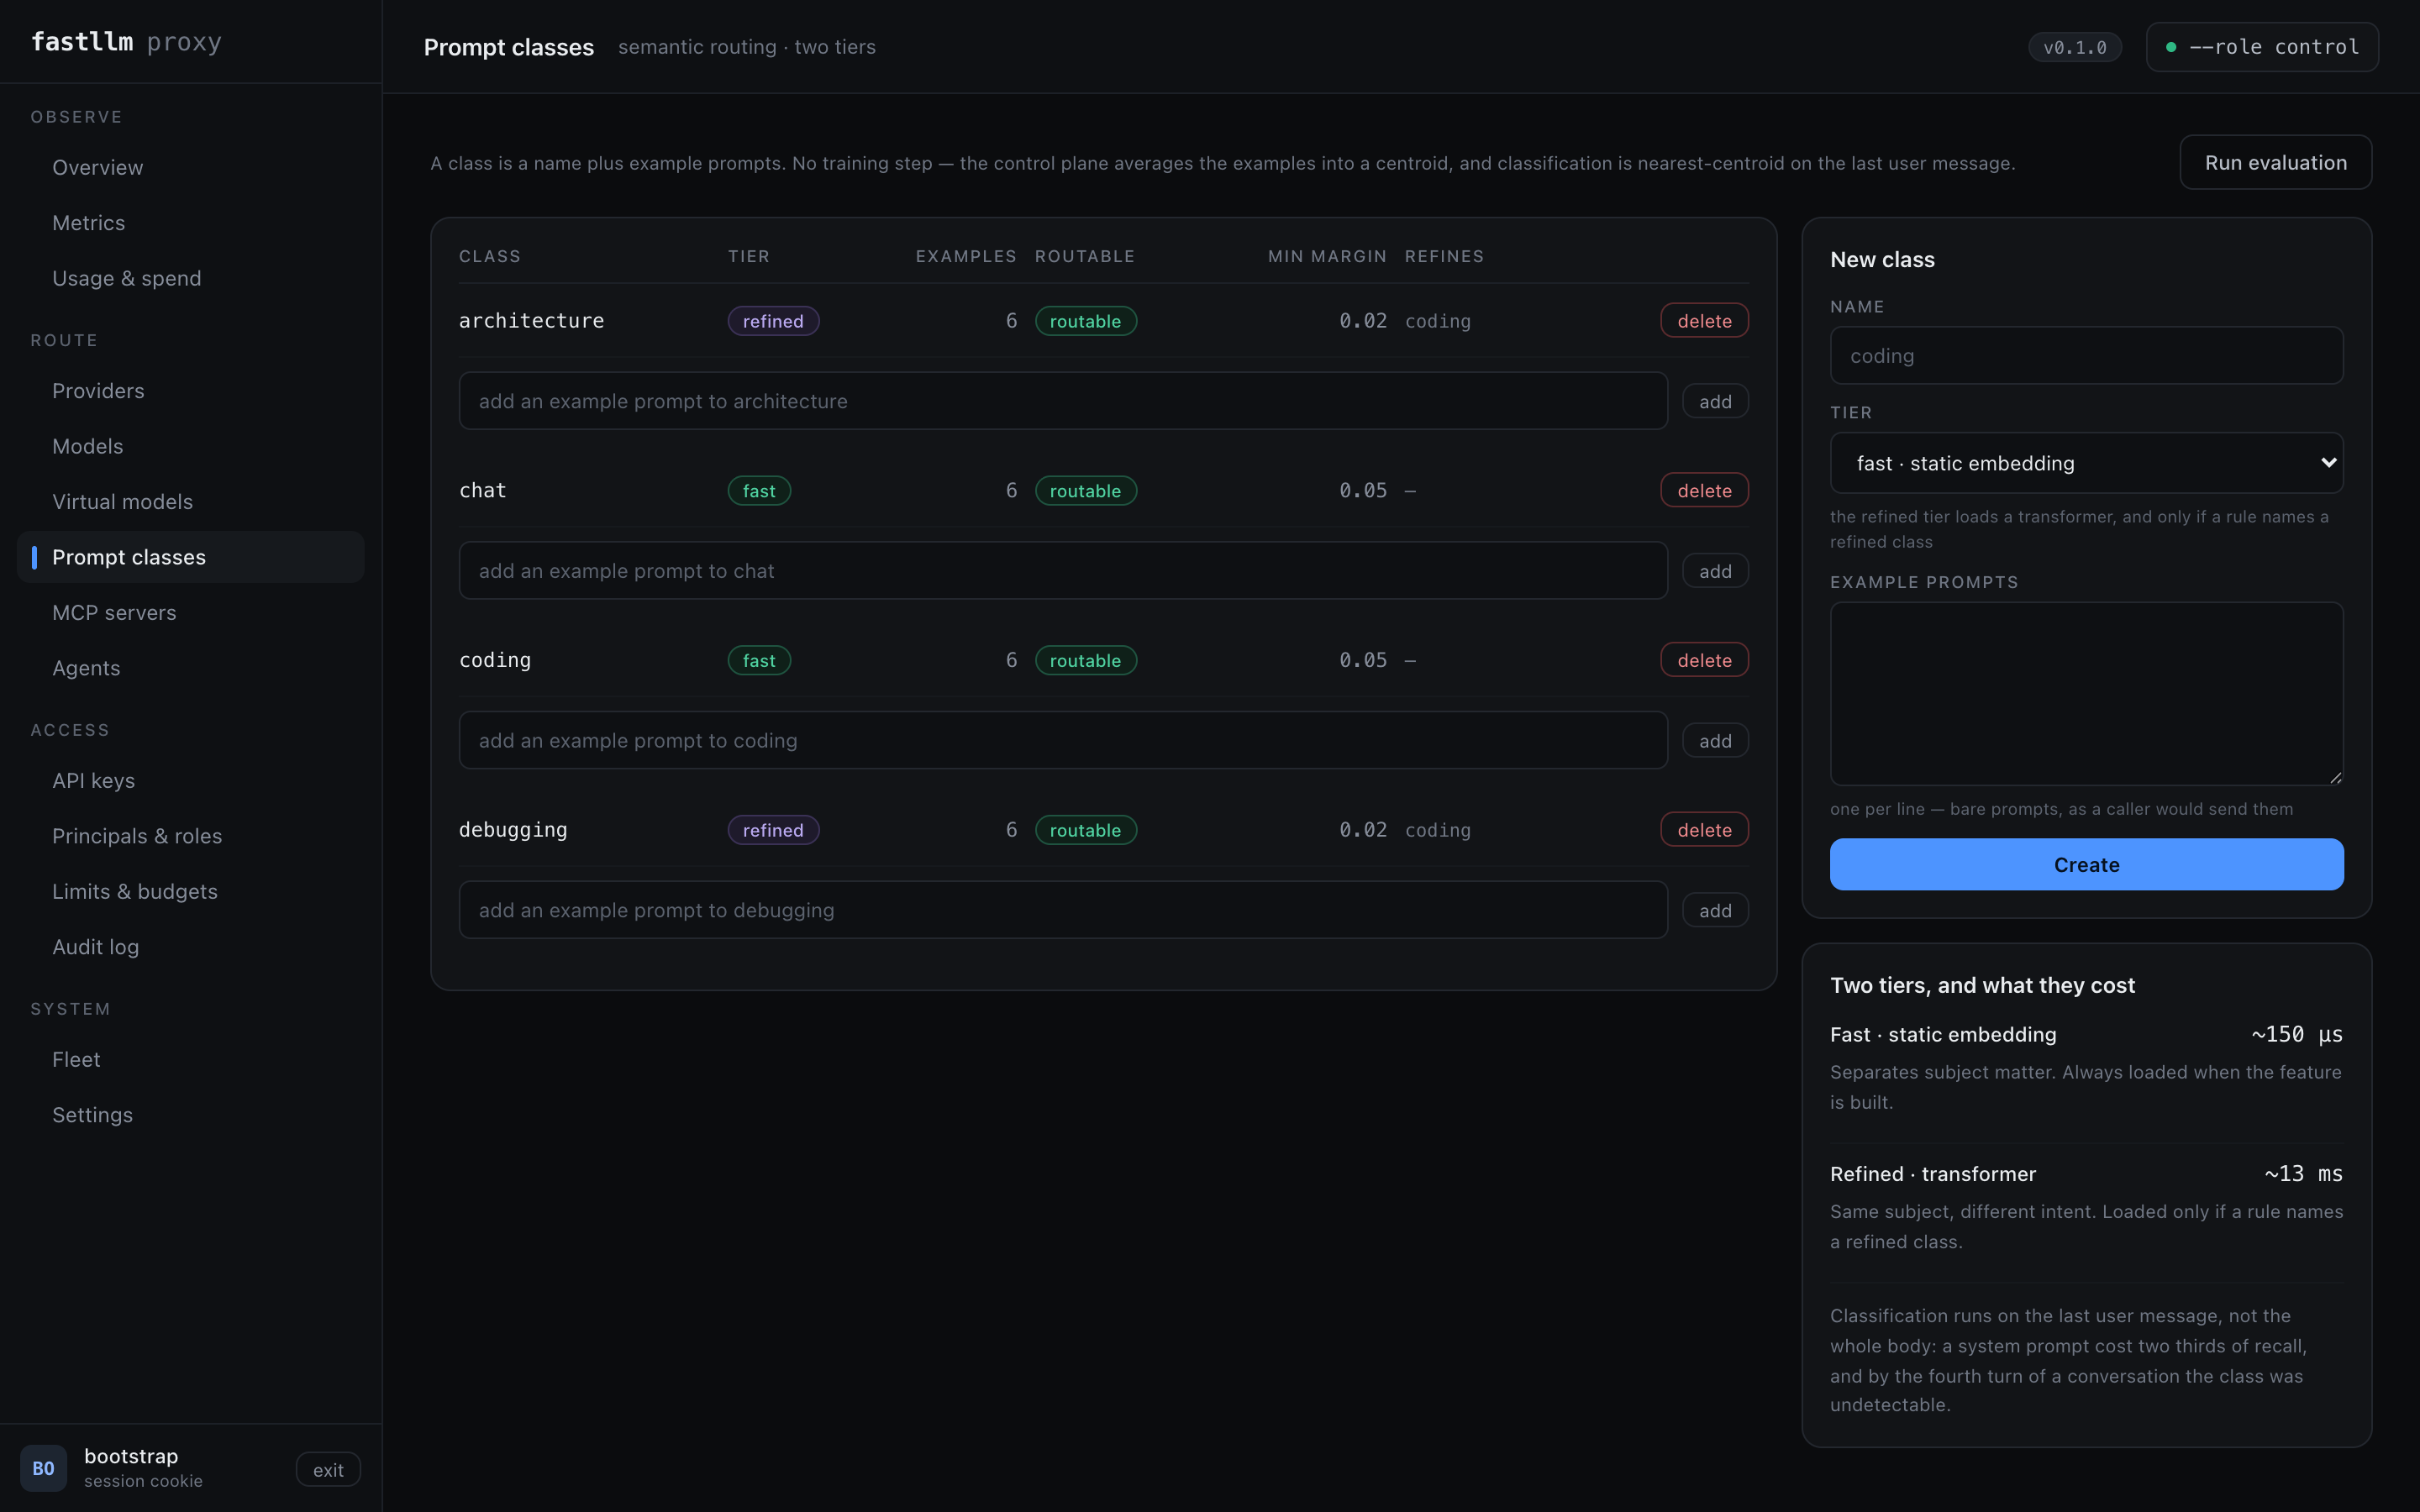
A class is a name plus example prompts; there is no training step. Run evaluation scores every example against centroids that exclude it, so the precision and recall it reports are not inflated by the example being inside its own centroid.
Principals & roles — who may invoke what
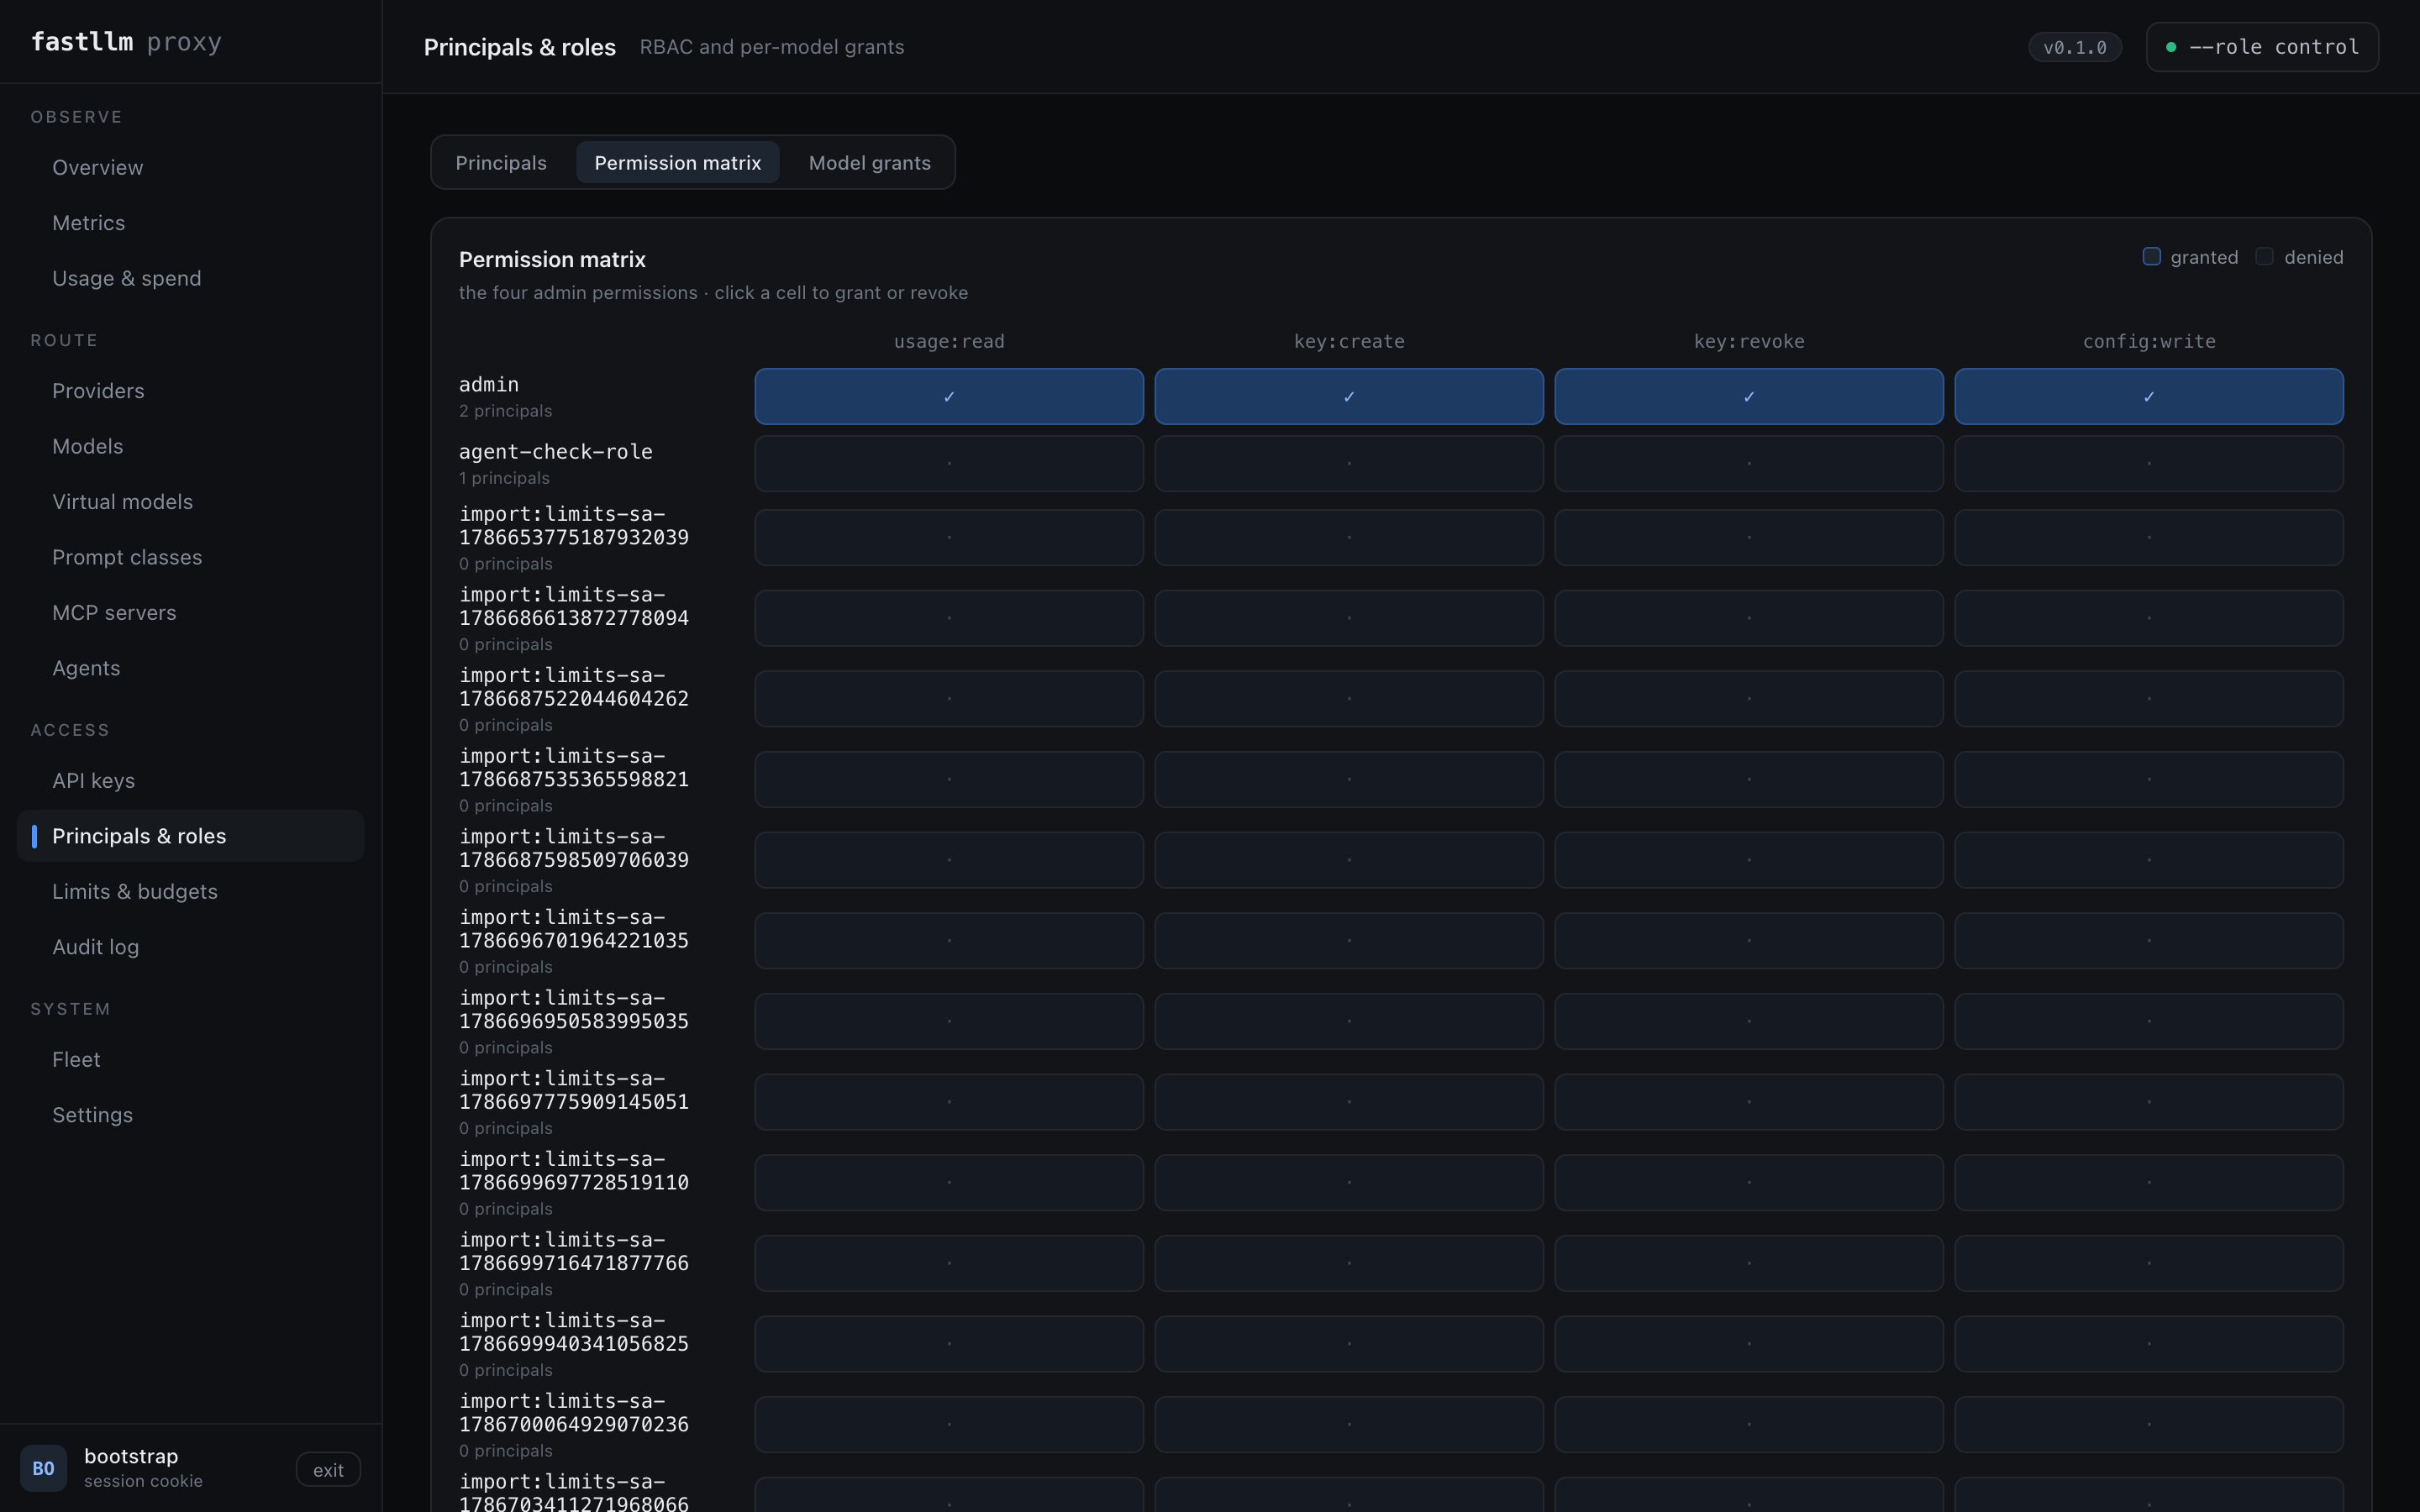
Roles carry permissions; principals hold roles. The matrix is the clearest
single picture of it — click a cell to grant or revoke. Model grants is the
same idea for model:invoke, per model.
A grant on a frontend model does cover the chain it routes to — the frontend model is the exposure, so granting it grants what the operator pointed it at. It is not a skeleton key: naming a provider model directly still needs a grant on that model.
This reversed a rule that required a grant on the resolved provider model. That
rule pinned every grant to a provider model's name, so renaming one revoked
access with nothing reporting it — see
.procoder/adr/0002-authorisation-moves-to-the-frontend-model.md.
Limits & budgets — caps that are enforced without a database call
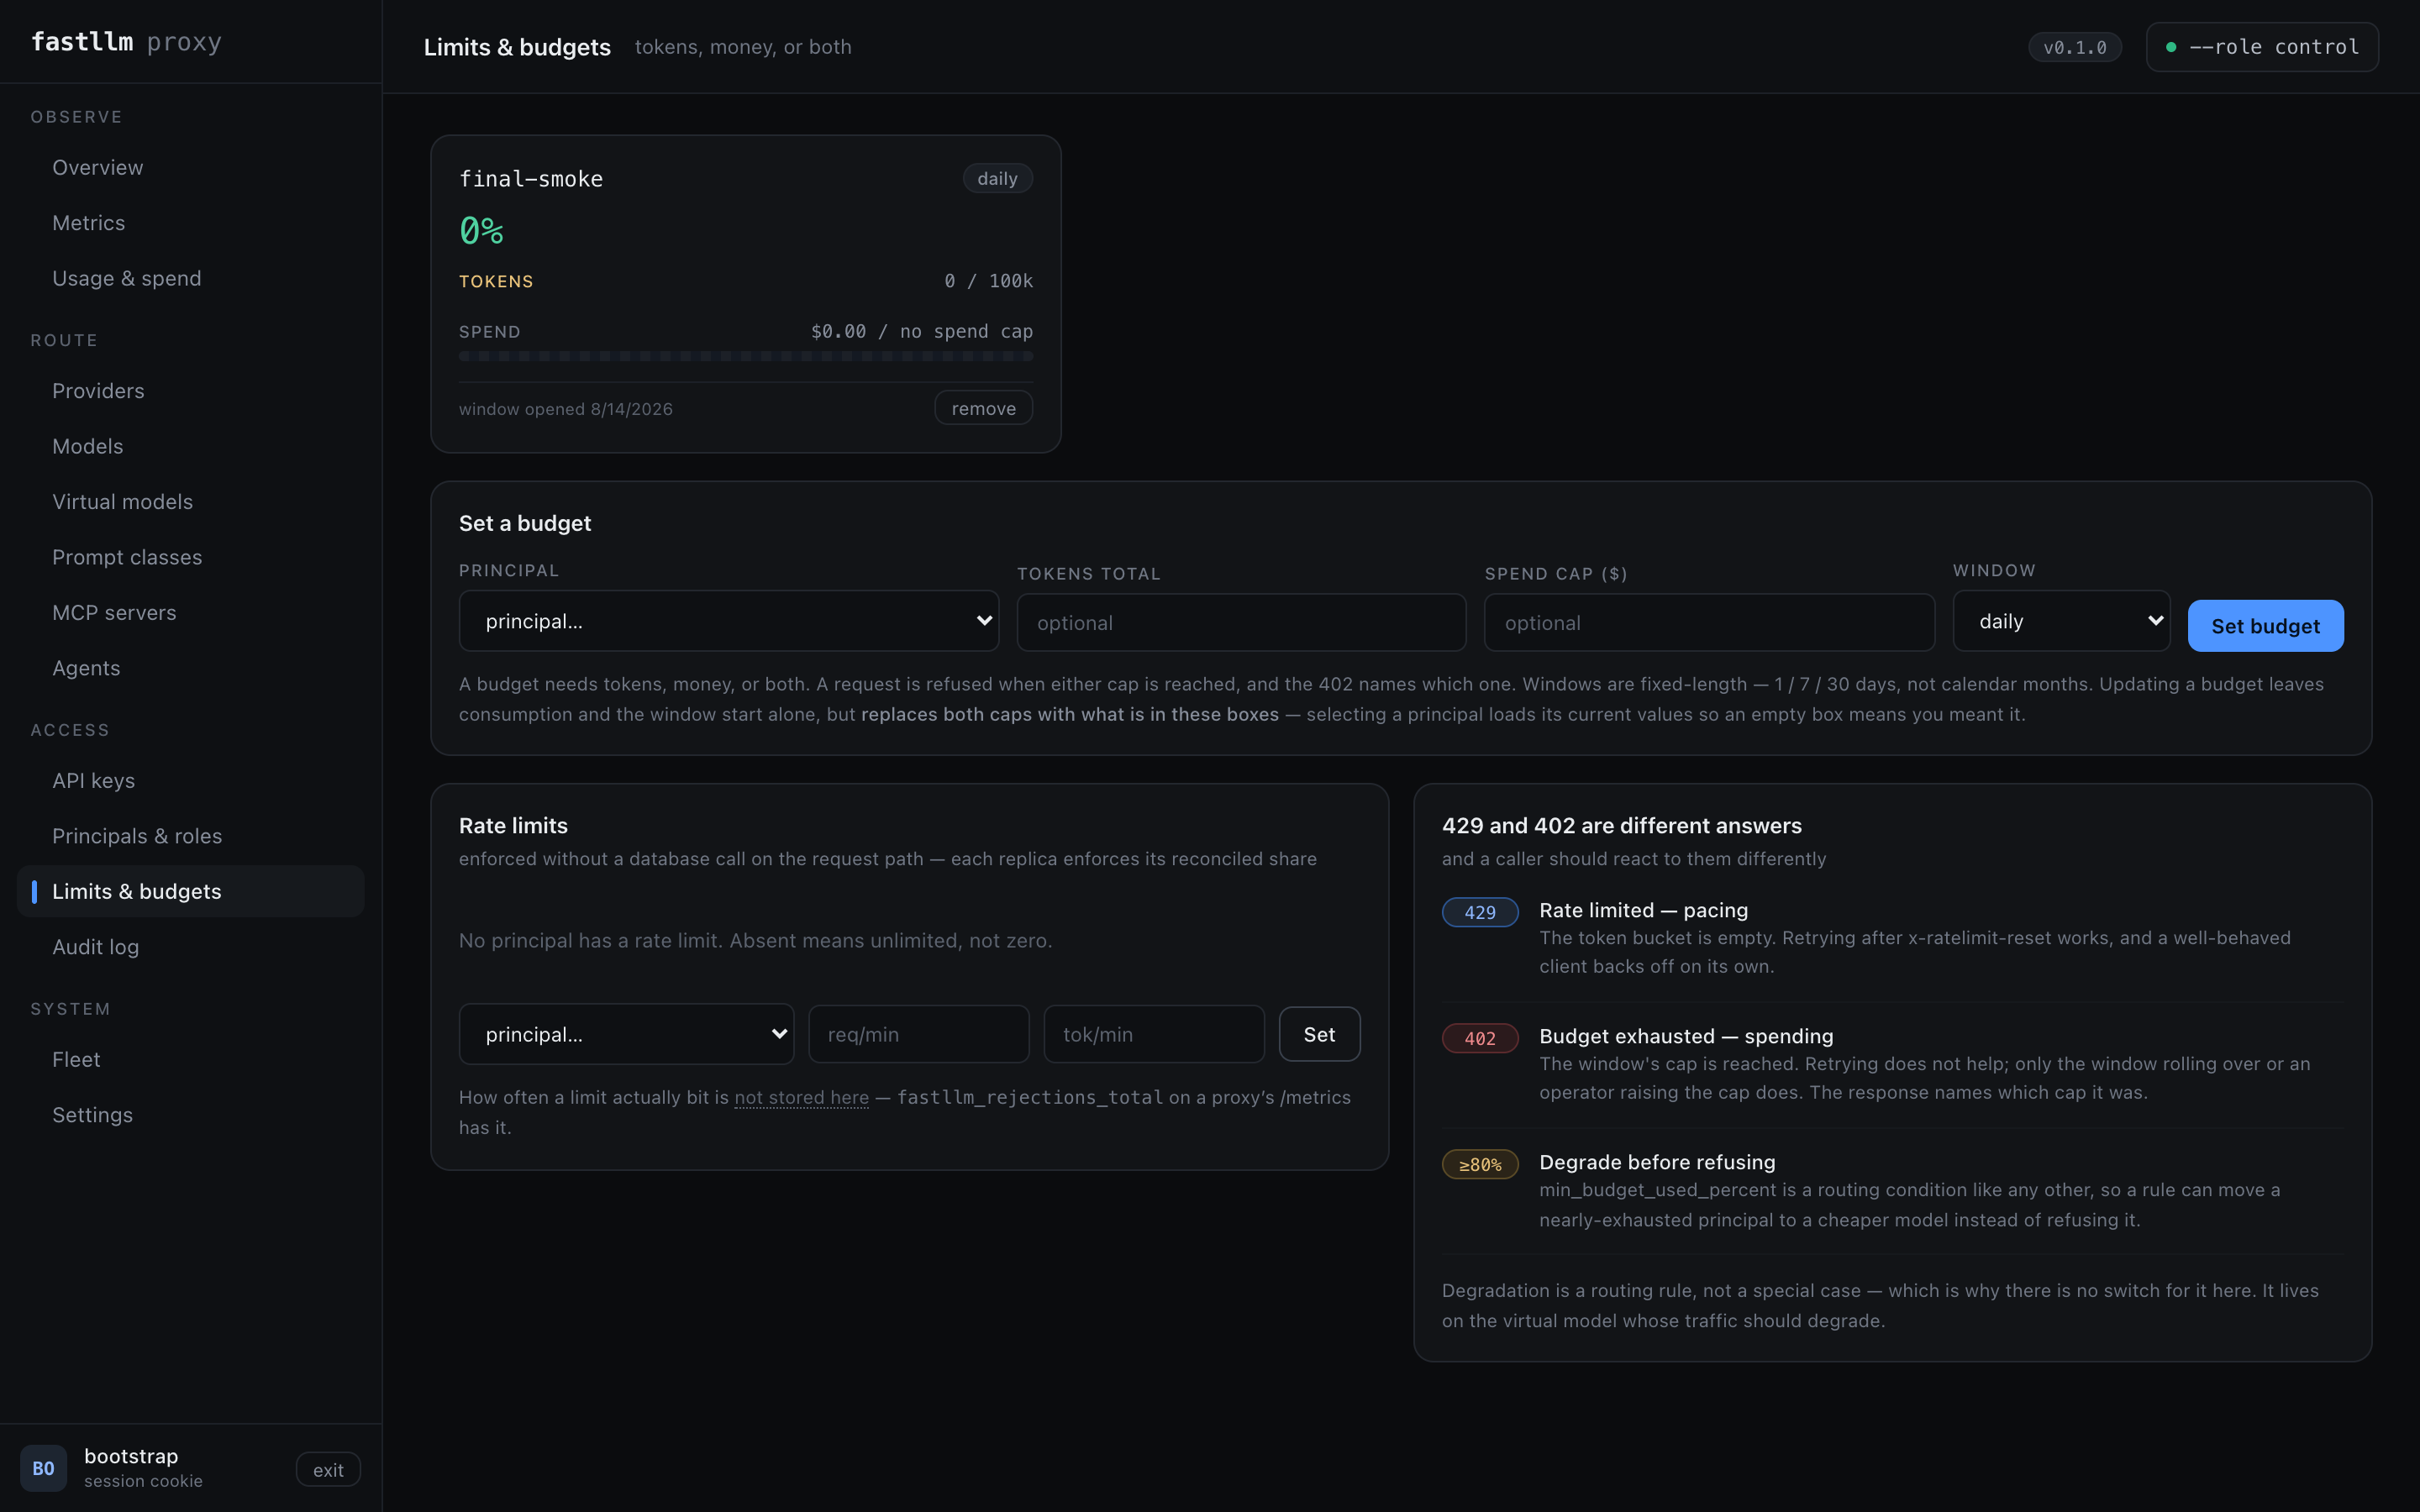
Rate limits are per minute, budgets are per window. Both are resolved into the snapshot, so enforcing them costs an integer comparison on the request path rather than a query. A request that pushes a principal over budget completes; the next one is refused with 402, not 429 — waiting does not help until the window rolls over.
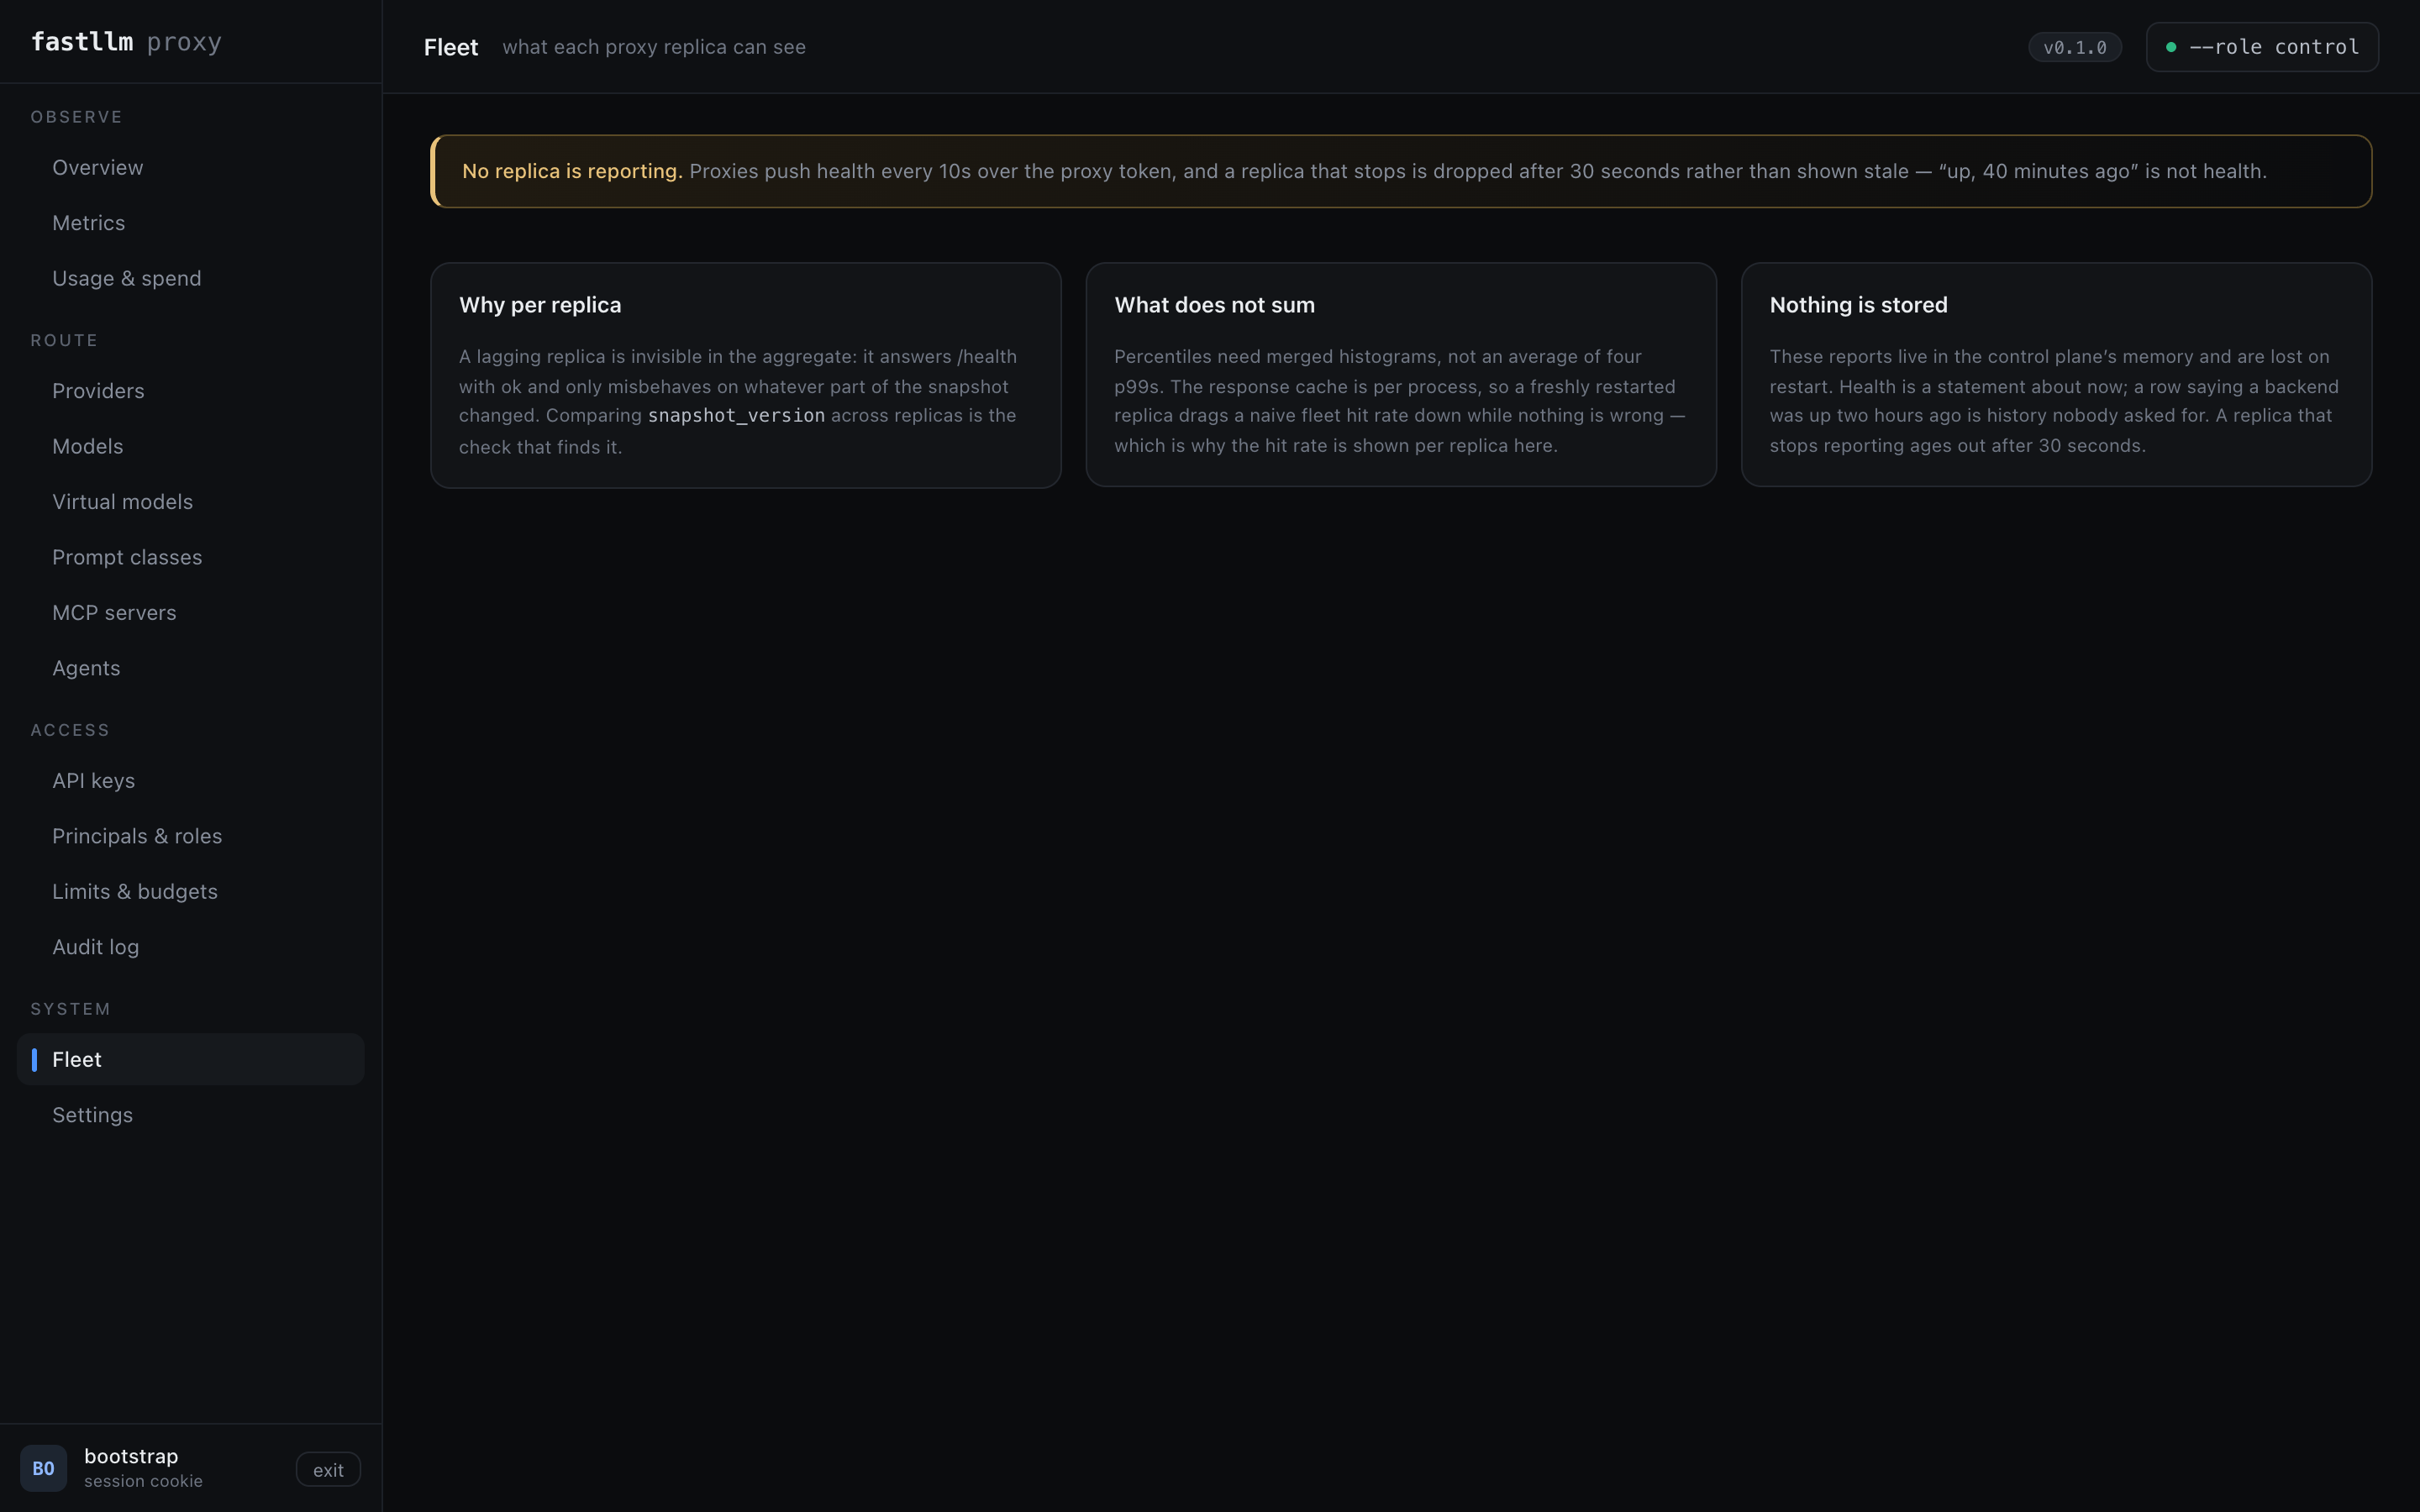
Fleet — what each replica can see
Each backend row carries its prefix-cache hit rate, which is what makes
cache-affinity auditable. The policy routes by a hash of the prompt's first
bytes and assumes the chosen backend still holds that prefix; nothing used to
verify it, so a backend that restarted kept winning the same sessions while
re-prefilling every turn — the exact cost the policy exists to avoid. A dash
means unknown: no counters, no lookups yet, or restarted since the last
scrape. It is deliberately not 0%, which would read as affinity failing on a
backend nobody has used.
The screen opens with a topology: the management plane, the worker replicas, and the engine hosts, with each box carrying its own health and counters. It is there for the three things a table cannot show — that the control plane sits beside the request path rather than on it, that every worker reaches every backend rather than one each, and that an agent is why a host is listed at all. An endpoint no agent registered says "registered by hand" rather than borrowing one, and every arrow carries the interval it actually runs on, read from the deployment's own configuration.
The tables below it are the detail. Per replica, deliberately unmerged. A
replica on an older snapshot answers
/health with ok and misbehaves only on whatever changed — most often a key
it has never seen — so the snapshot version per replica is the thing to look at
when one replica behaves differently from the others.
The screen distinguishes a replica that is catching up from one that is stuck, and does it by the age of the newest snapshot rather than by the gap between version numbers — versions are stamped when the configuration last changed, so the gap measures the control plane's edit history, not any replica's health. Polling and reporting are on separate timers, so lagging briefly after a change is normal and shows as a quiet "still picking up the snapshot" note. The red banner needs either a snapshot that has been available for longer than those timers can explain, or a replica the screen has watched stay behind that long — the second being what catches a frozen replica on a gateway busy enough that the snapshot is never old.
Audit log — every change, and who made it
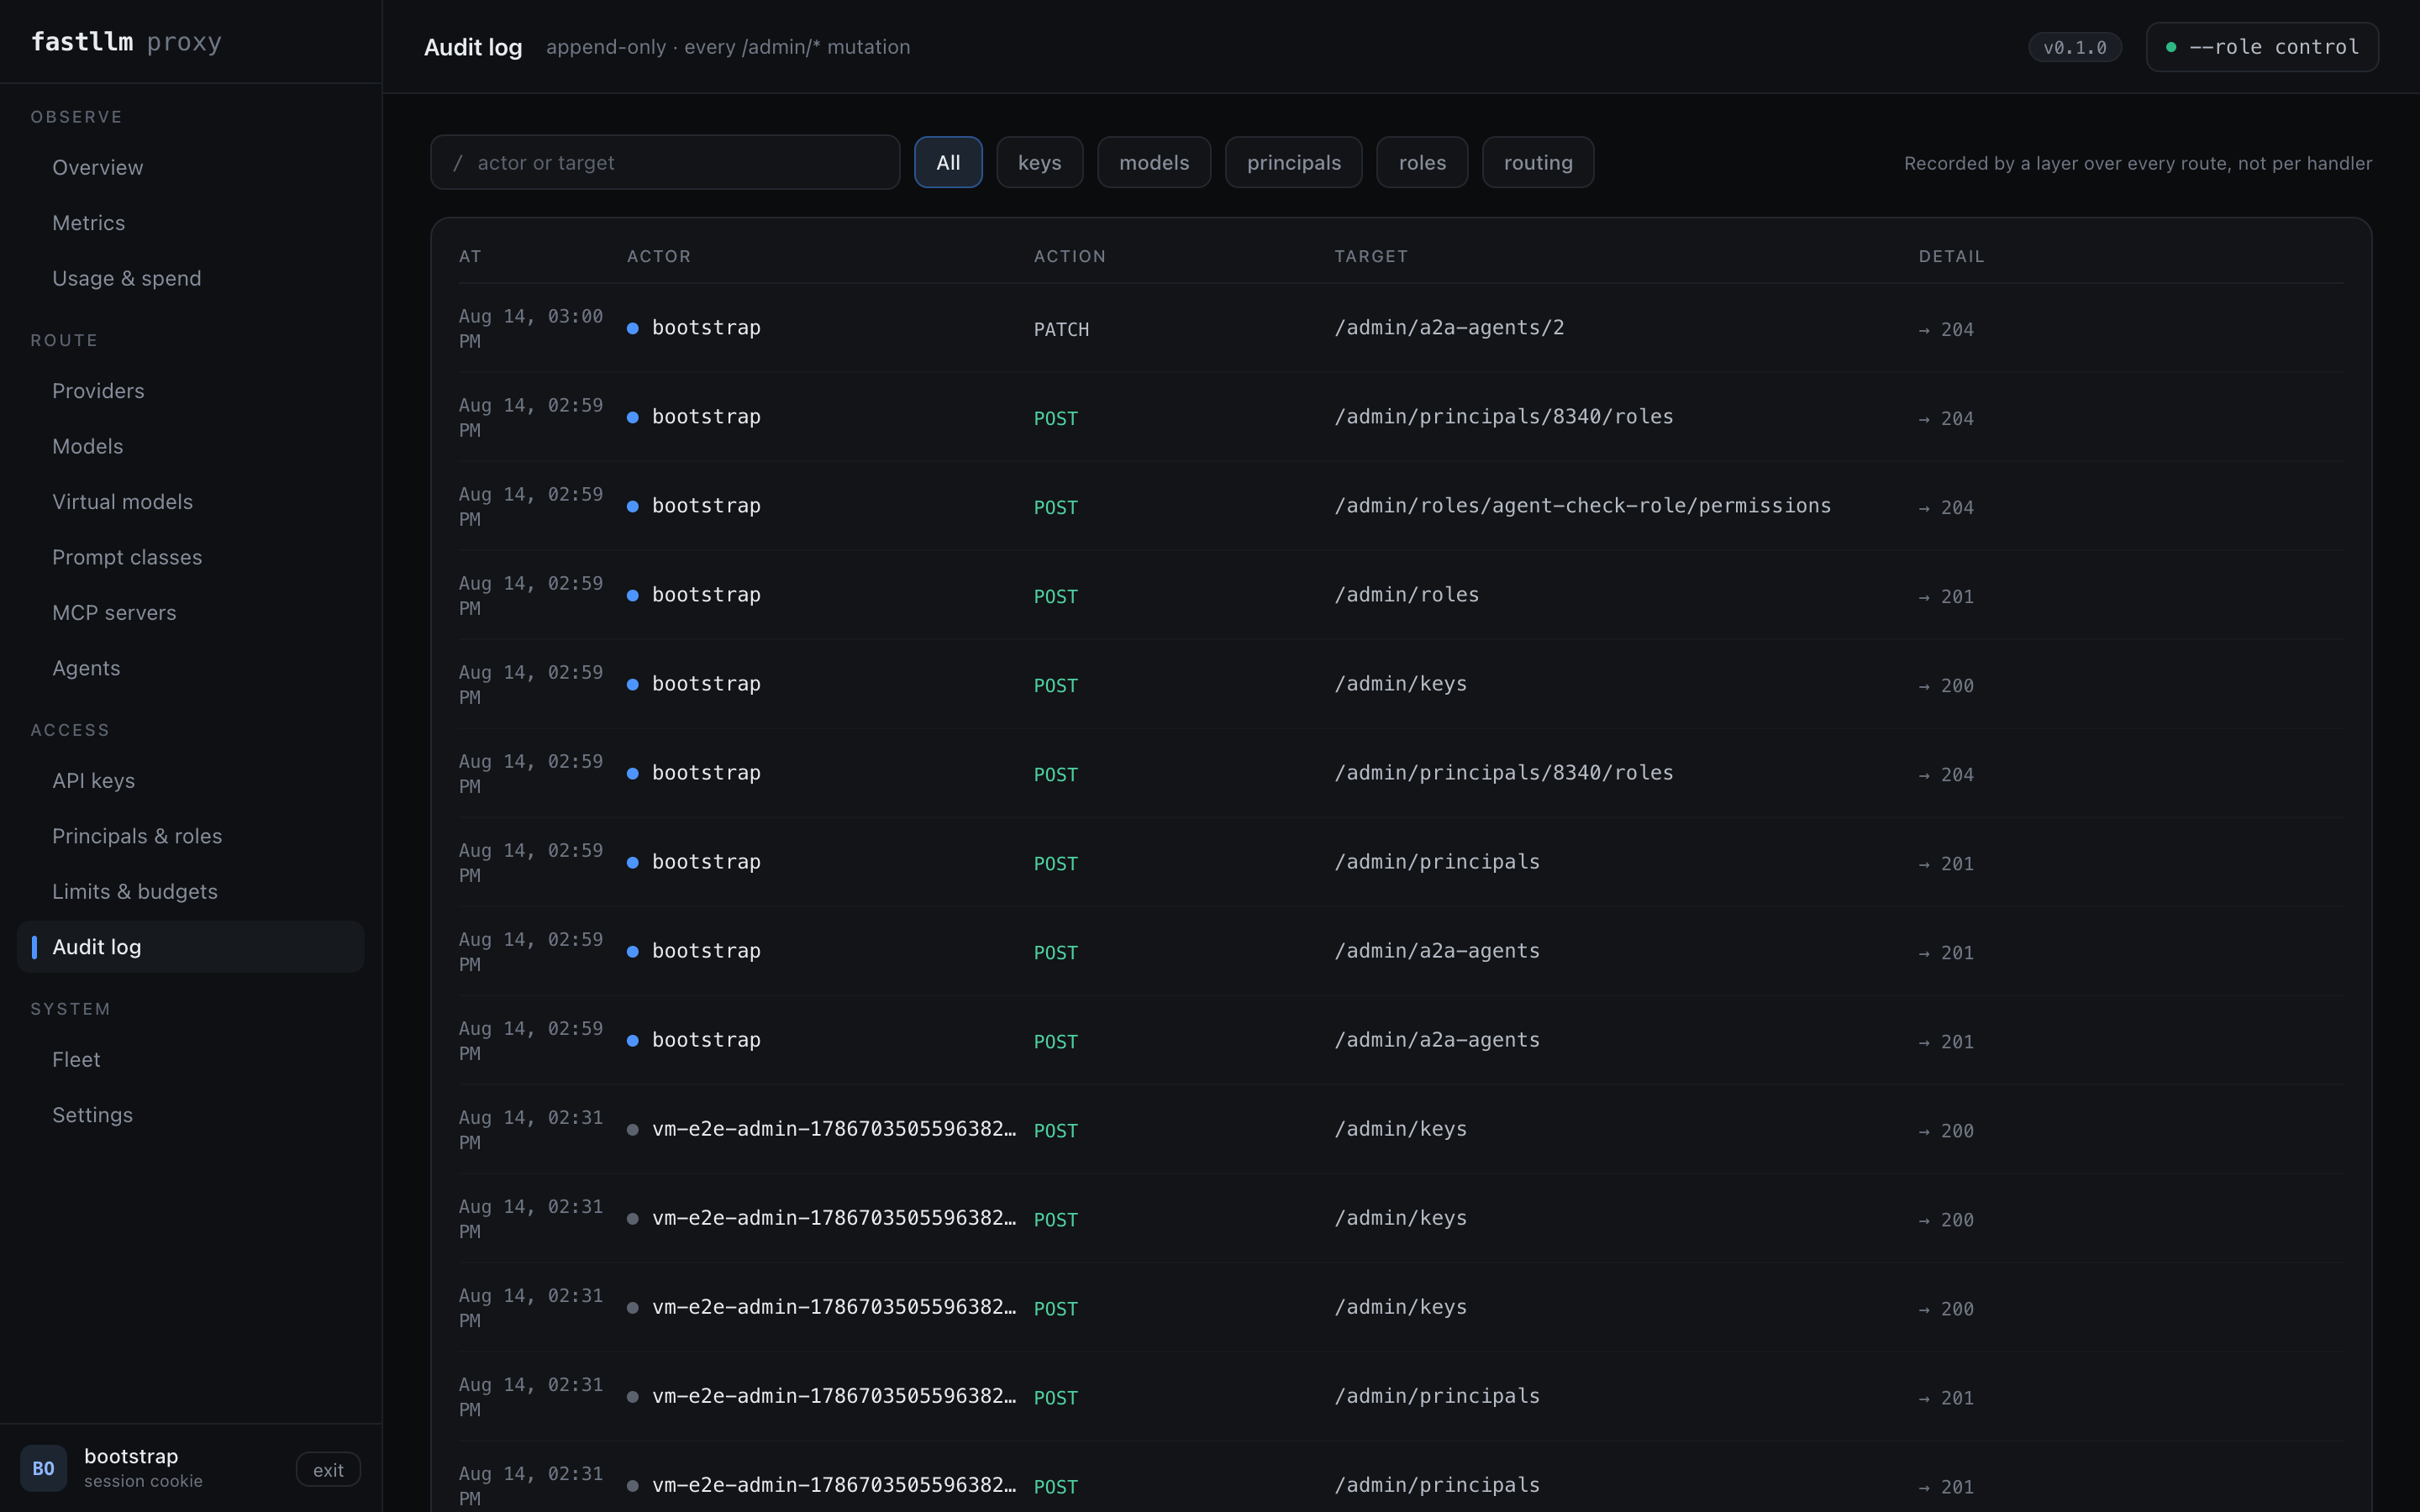
Append-only, newest first, filterable by actor or target. Reads are not recorded and neither are rejected attempts — it answers "what changed", not "who looked".
Settings — what this process was started with
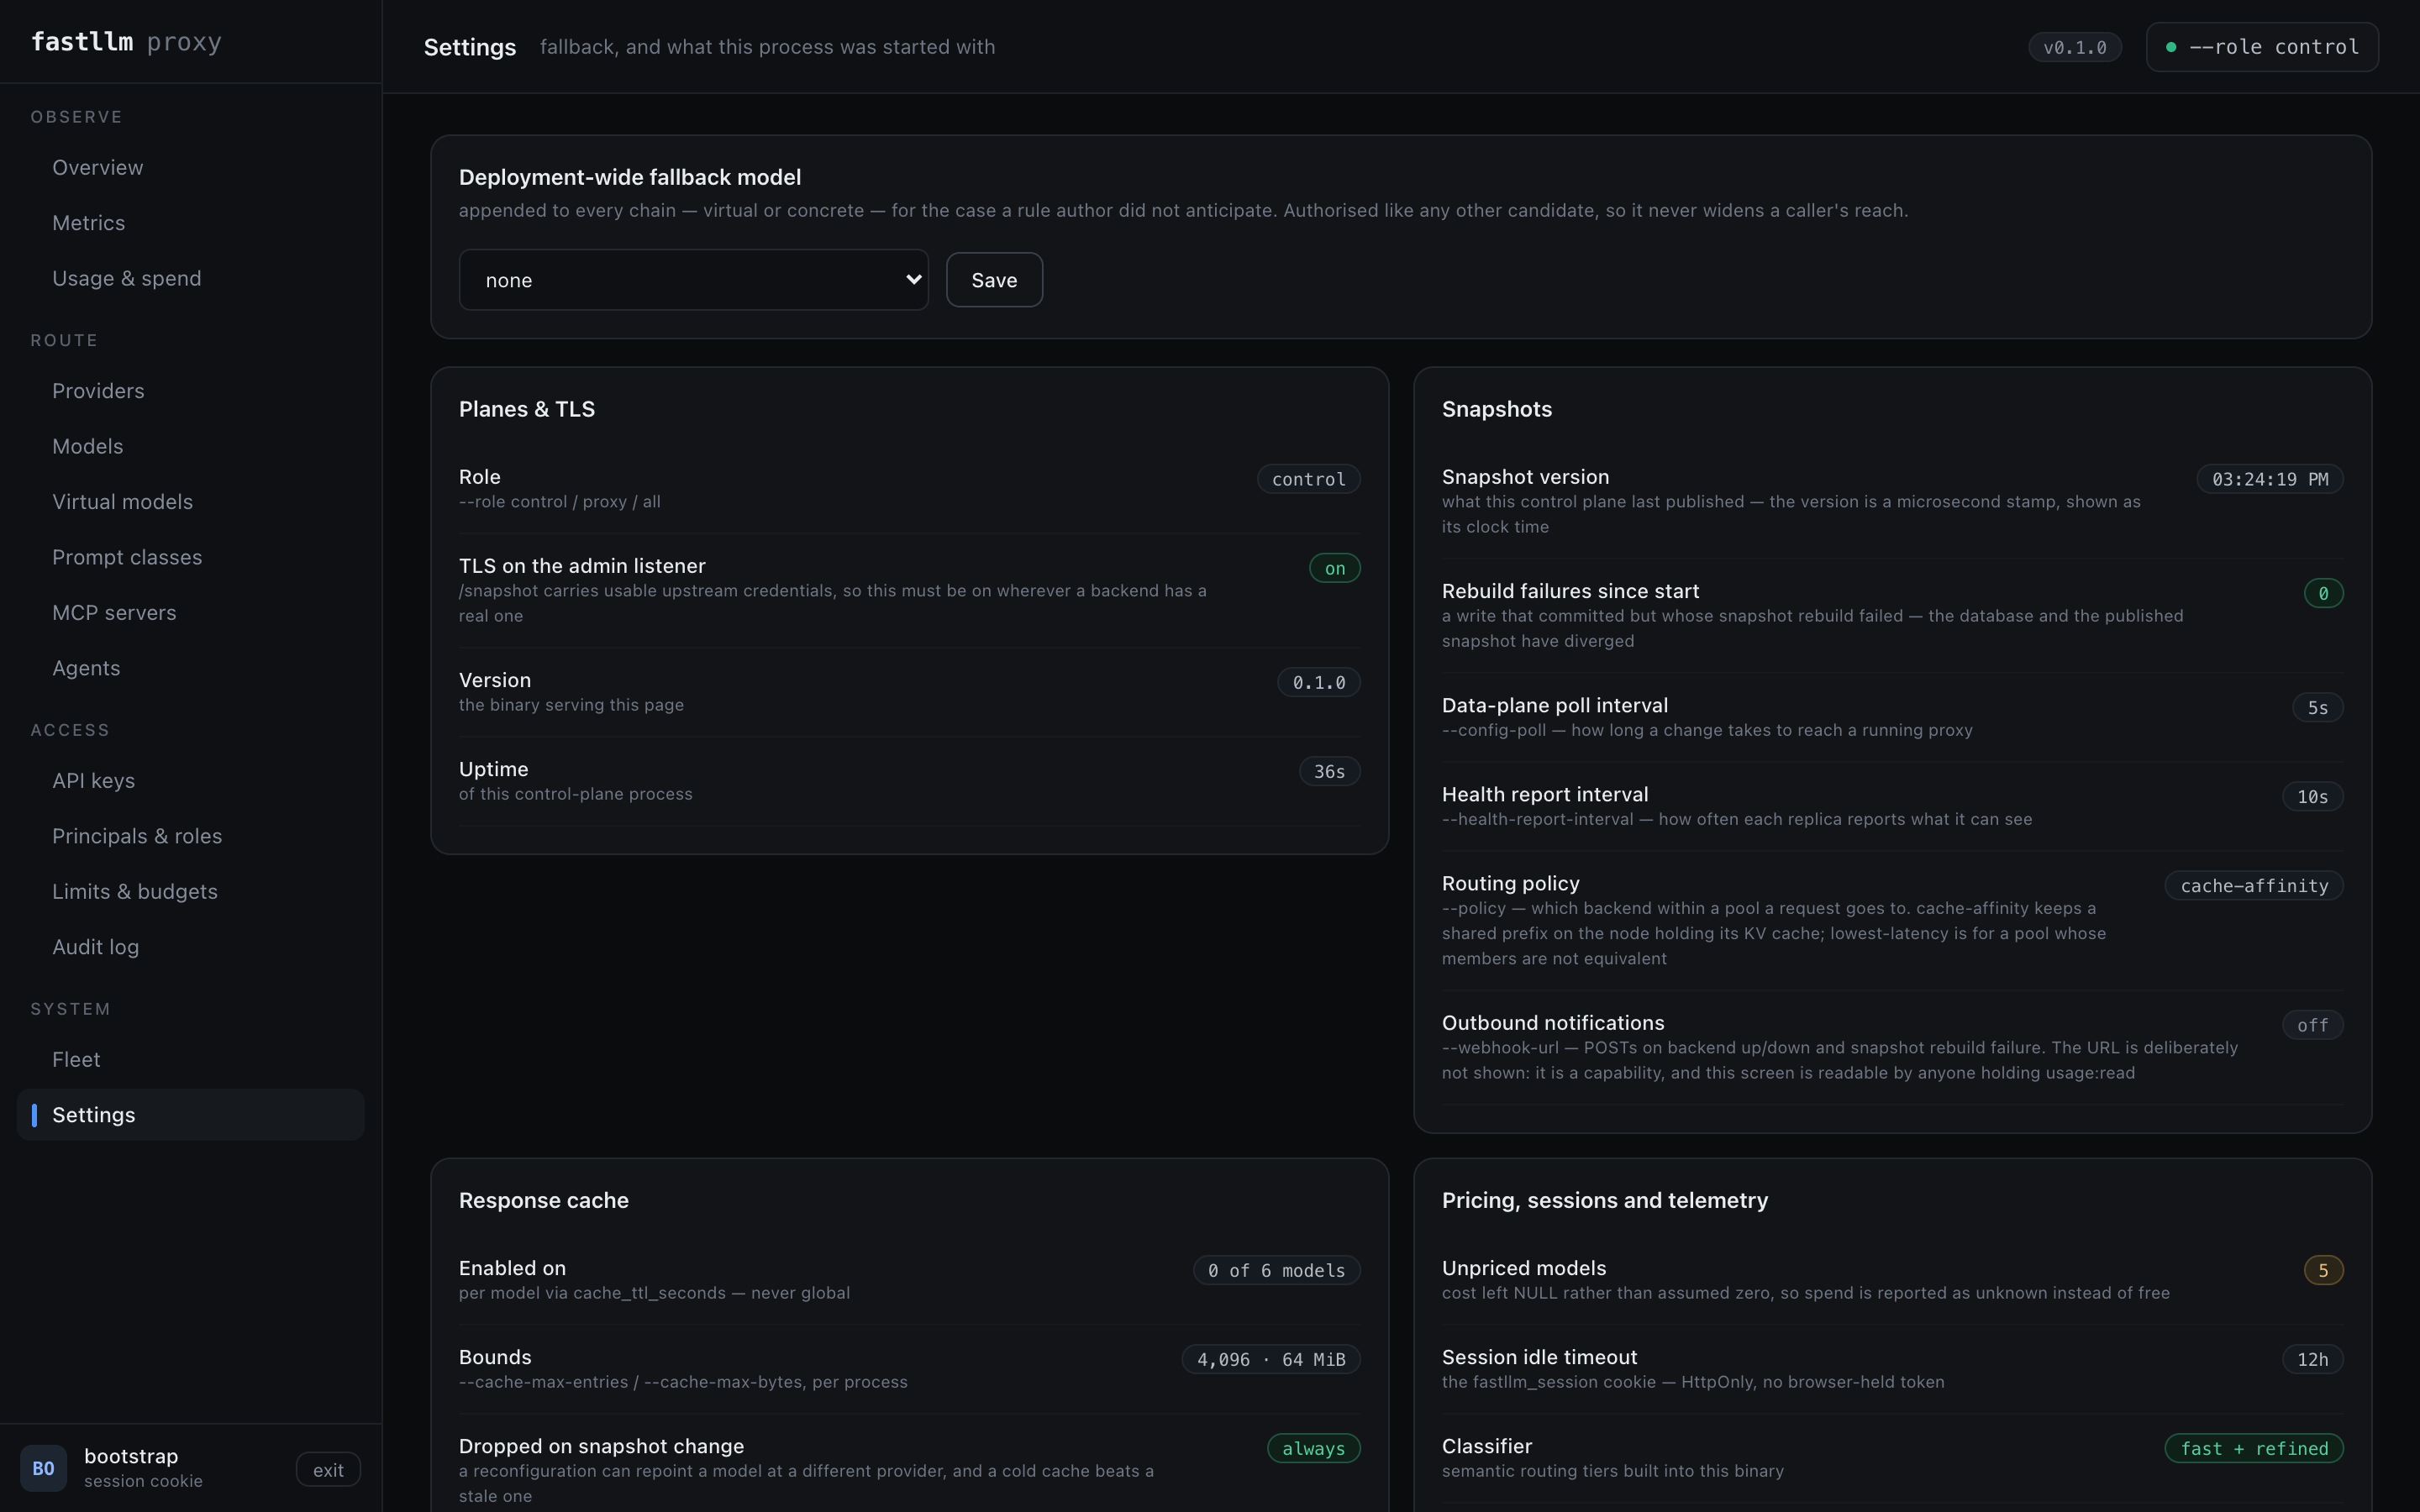
The flags this process is running with, the fallback model, and two actions worth being deliberate about: forcing a snapshot rebuild, and revoking every session including your own.
Where next
| Connecting a client | SDKs, coding agents, frameworks, observability |
| Troubleshooting | The failures people actually hit |
| Operations | The three roles, deployment shapes, configuration |
| API and administration | Every endpoint, and openapi.json |
Deployment
Only under the Kubernetes operator. Every other screen edits a row in
Postgres; this one edits the FastllmProxy resource that describes the
deployment itself — image, gateway replicas, selection policy, upstream
timeout, worker count, connection pool, and autoscaling — alongside the phase,
the conditions, the config hash and the image that is actually serving,
which during an ordered upgrade is not the one in the spec.
Applying a change patches the resource and hands it to the operator. The page says so: a rollout is not a snapshot, and reporting "saved" while two Deployments are still turning over would be a lie of tense.
Installs without an operator do not have this screen at all — not disabled, absent — and the routes behind it answer 404. See the operator.