The lowest-overhead
LLM router.
One OpenAI-compatible endpoint in front of everything you serve. Written in Rust for teams putting real traffic through more than one model or node — 0.76 µs of work per request, and no I/O on the request path at all.
What it is
RBAC, per-model grants, rate limits and budgets are integer comparisons against a snapshot already flattened in memory. A test in the repo fails the build if anything I/O-shaped lands there.
An upstream's frames reach your client exactly as they arrived — never deserialised, never re-encoded, never buffered. Cost does not grow with how much your users read.
A shared prefix goes back to the node already holding its KV cache, unless that node is meaningfully hotter than the least-loaded one. Round-robin makes every request pay full prefill.
A proxy that loses its control plane keeps serving from its last-known-good snapshot. Health is per replica, never merged, and SIGHUP swaps the routing table without touching in-flight generations.
The numbers, and their conditions
Measured against LiteLLM on the same cluster, same backends, interleaved A/B runs — with the GPU removed, so the gateway is the only thing being measured.
With real GPUs, aggregate throughput is a wash — both gateways saturate the same hardware. What survives contact with real silicon is steadiness: p99 TTFT of 766 ms against 2921 ms at 32 concurrent streams, and inter-token jitter 15–25% lower at every concurrency level.
Every number, its conditions, and what was not measured →
What you get
The full list, with its measured trade-offs and honest limits →
Routing you can inspect before you trust it
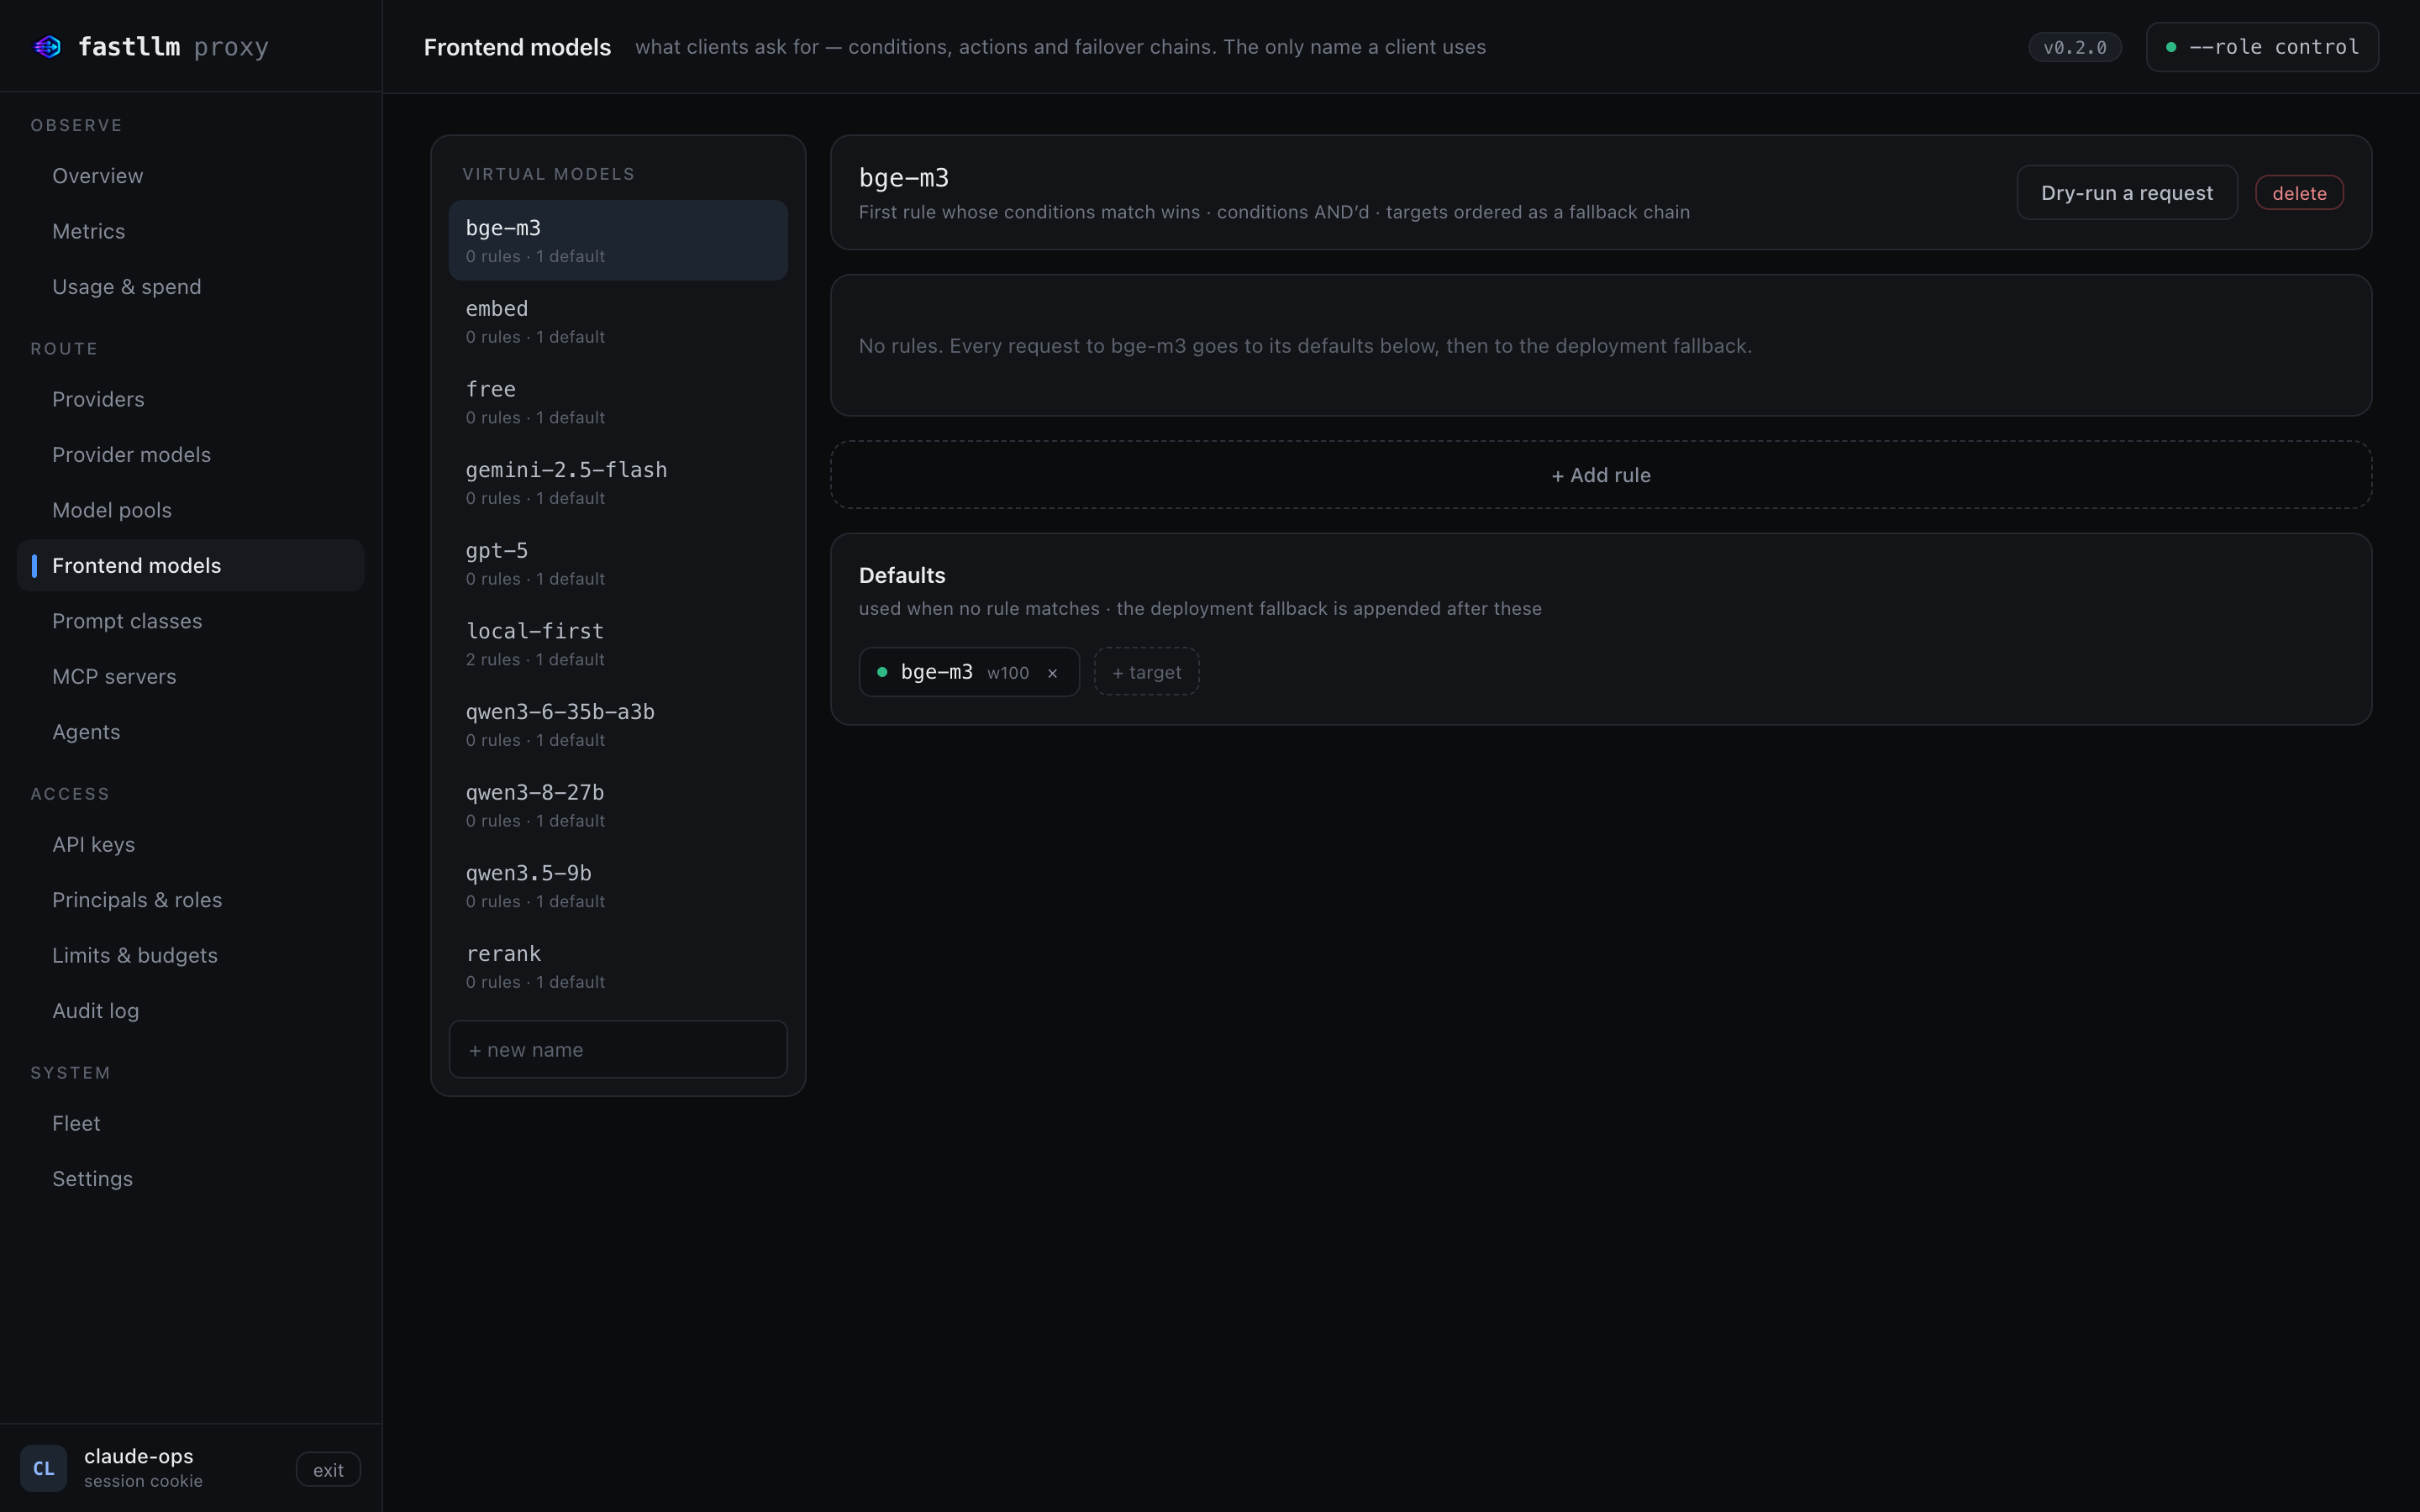
Dry-run answers which rule would decide and what the chain resolves to, without dispatching anything — because a routing table you cannot interrogate is a routing table you find out about in production.
History, not just a live view
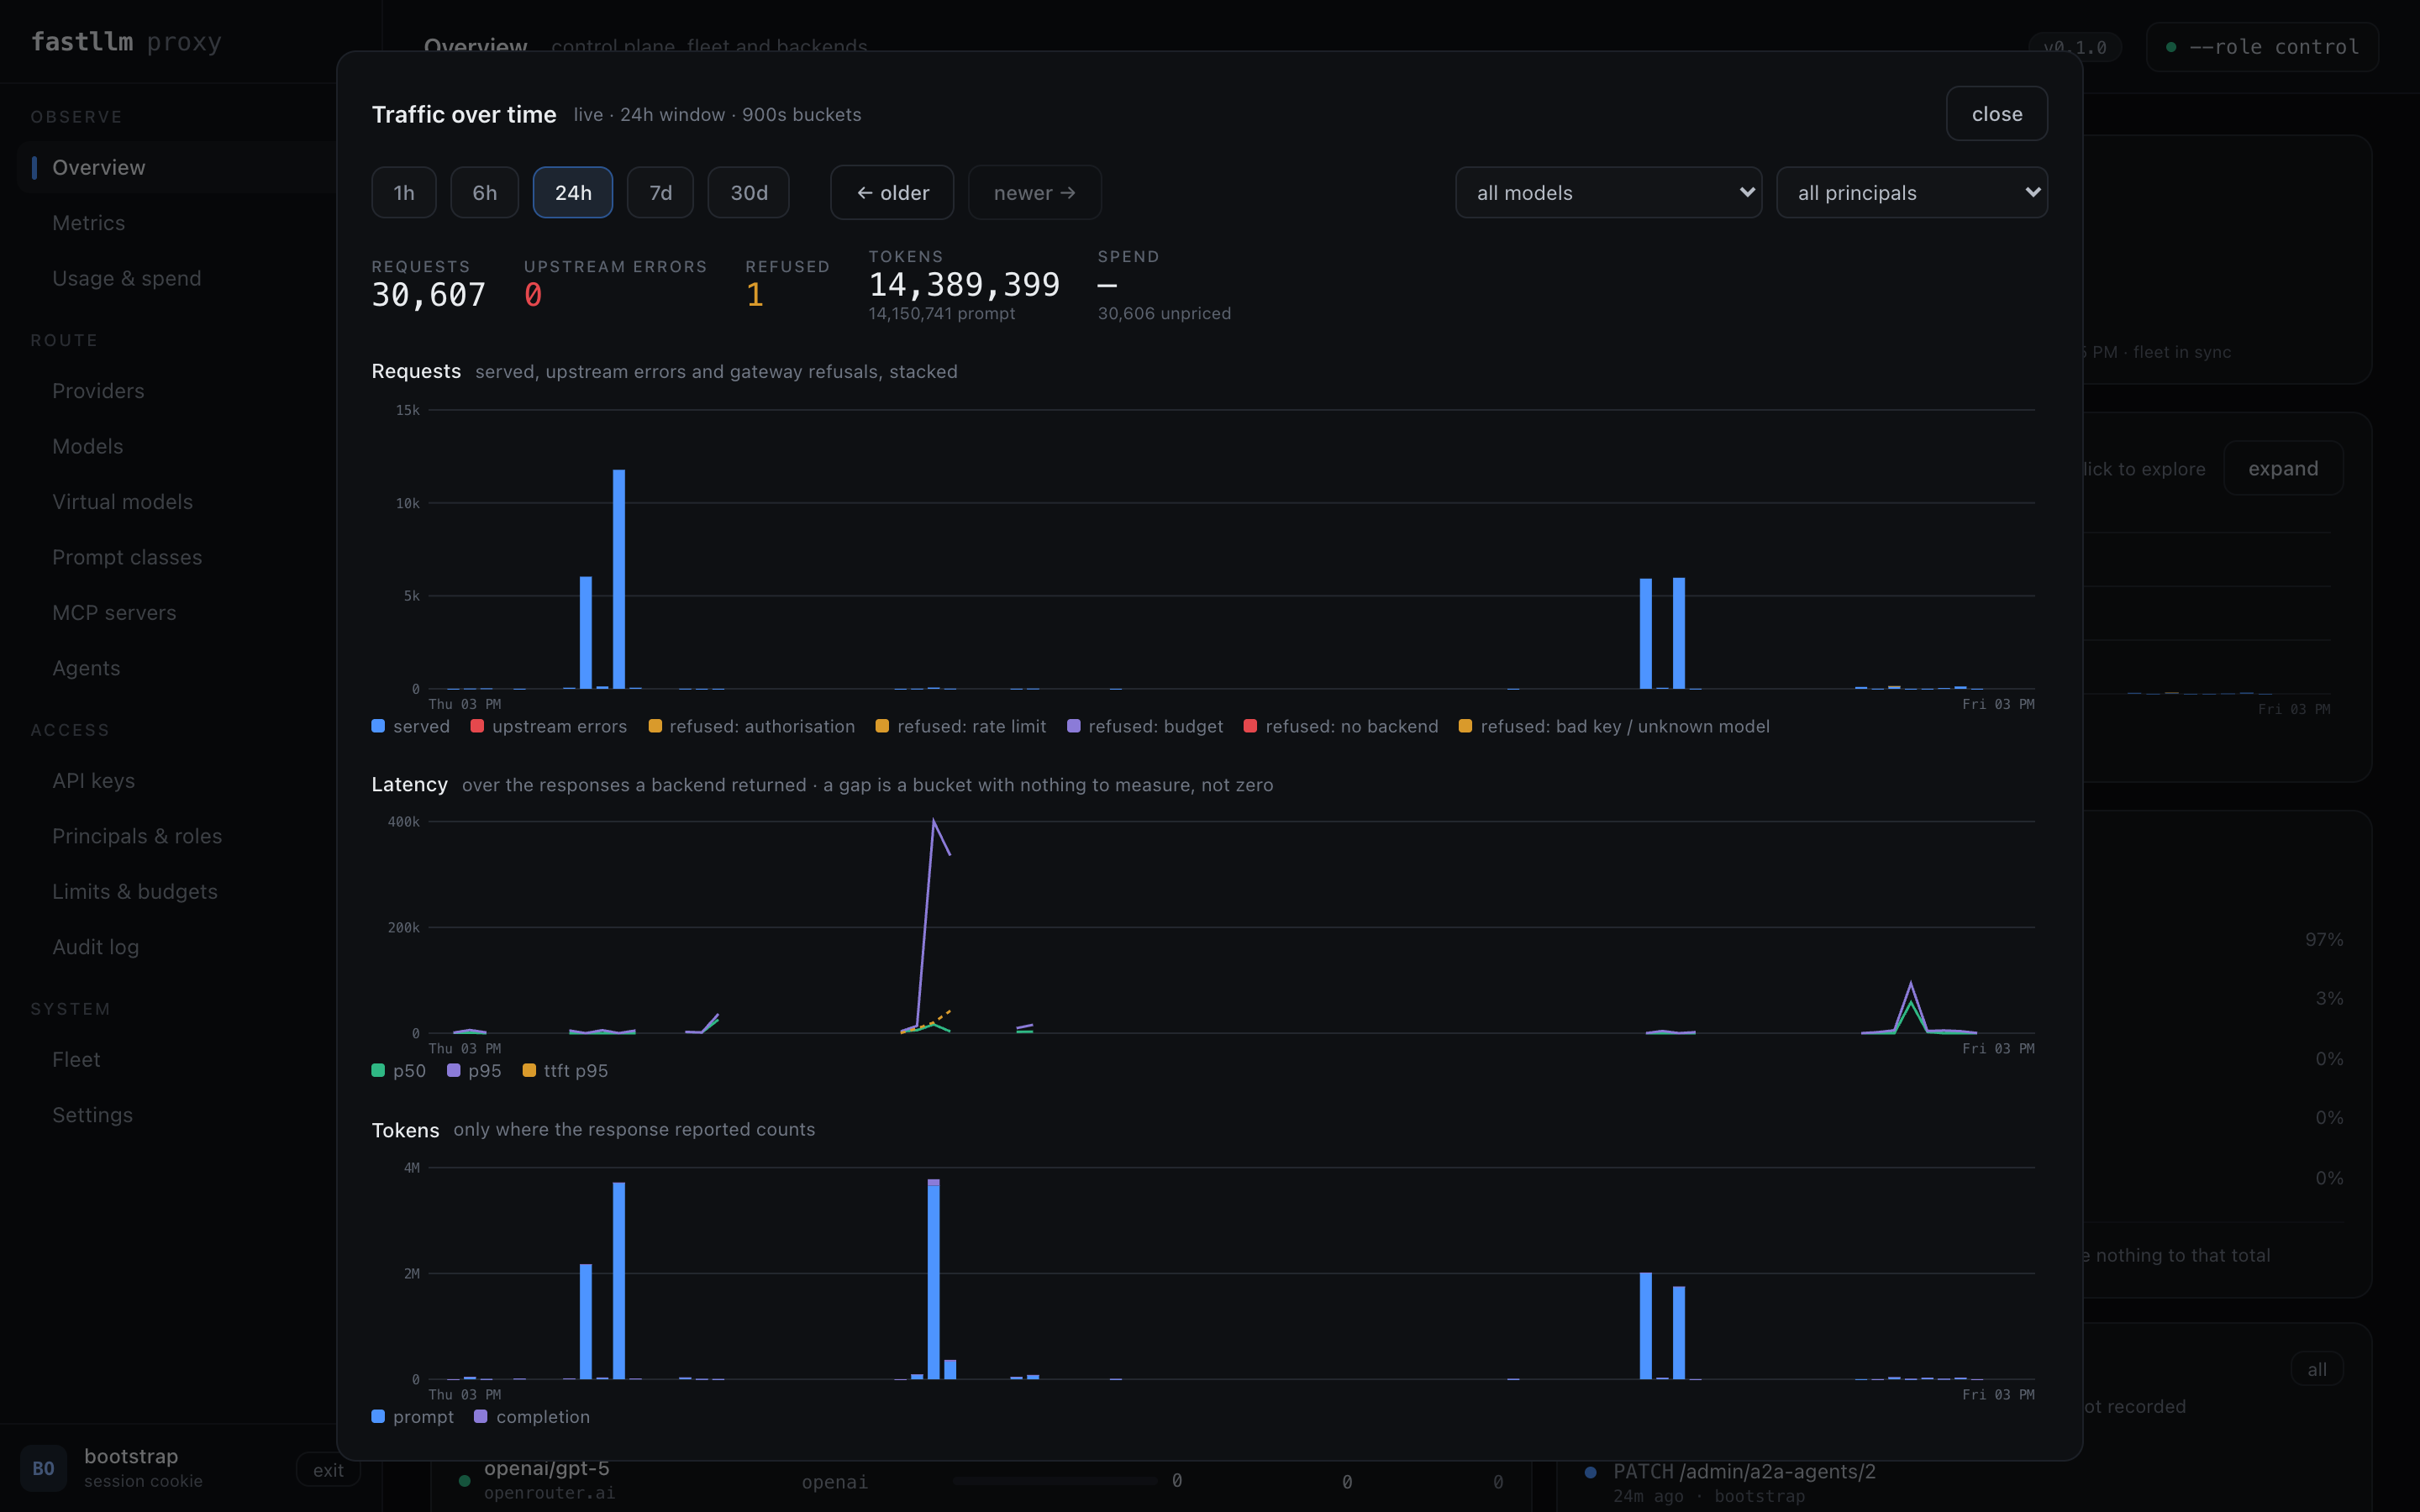
Requests stacked as served / upstream errors / refusals-by-kind — because a caller stopped by a budget and a backend that fell over need different people to do different things. A gap in the latency line is a bucket with nothing to measure, never zero.
Already running LiteLLM?
fastllm-proxy import --config litellm_config.yaml --database-url postgres://...
Models, backends, keys and each key's per-model grants come across. Idempotent — re-importing an edited file converges rather than duplicating, and grants removed from the file are revoked. Your existing keys keep working against the same models they already had.
Start here
Deploying to Kubernetes: the Helm chart, or the worked manifests for one real cluster. Everything else — troubleshooting, security, the CLI, the API, the changelog — is in the sidebar.
Getting started
From nothing to a served request, then a tour of what you just installed.
Assumes you have at least one OpenAI-compatible inference server running — vLLM, SGLang, llama.cpp, Ollama, or a hosted provider's endpoint. This gateway sits in front of those; it does not run models itself.
1. Bring it up
git clone https://github.com/azrtydxb/Fastllm-proxy && cd Fastllm-proxy
docker compose up -d
That starts Postgres, applies the migrations, and runs --role all — control
plane and gateway in one process. Two ports:
| :4000 | the gateway. Point clients here |
| :4001 | the admin API and the management UI |
Nothing is configured yet: no models, no keys, and no way in. That is deliberate — there is no default password to forget to change.
2. Give yourself a login
docker compose exec fastllm fastllm-proxy set-password --name you --password 'change-me'
The first login created this way gets the admin role automatically. Every
later one has to be granted permissions explicitly, which is the point:
a password proves who is calling, not what they may do.
Open https://localhost:4001/ and sign in. Your browser will warn about
the certificate — it is self-signed unless you supplied one.
The five nouns
Everything below is one of these, and the relationships are the whole data model:
flowchart LR
    subgraph SERVE["what gets served"]
        M["<b>model</b><br/>a name clients ask for"] --> B1["<b>backend</b><br/>somewhere serving it"]
        M --> B2["<b>backend</b>"]
        VM["<b>frontend model</b><br/>a name with rules"] -.->|targets| M
    end
    subgraph WHO["who may ask"]
        PR["<b>principal</b><br/>a person or a service"] --> RO["<b>role</b>"]
        PR --> KY["<b>key</b> sk-…<br/>or a password"]
        RO -->|model:invoke| M
    end
A model may run at several providers at once; the same model on two hosts is one provider model with two backends, and the two form a pool the proxy chooses within. A principal holds roles; roles carry grants; a key is how a principal proves it is that principal. Nothing else needs explaining before the first request.
3. Add a model
A provider is somewhere that serves models — a vLLM host, an OpenRouter account. A provider model is one model, attached to every provider that serves it. Running the same model on two hosts gives one provider model with two backends: one name, one context window, and a price per provider, since the same weights cost different amounts at different vendors.
On Models, create one, then attach it to a provider:
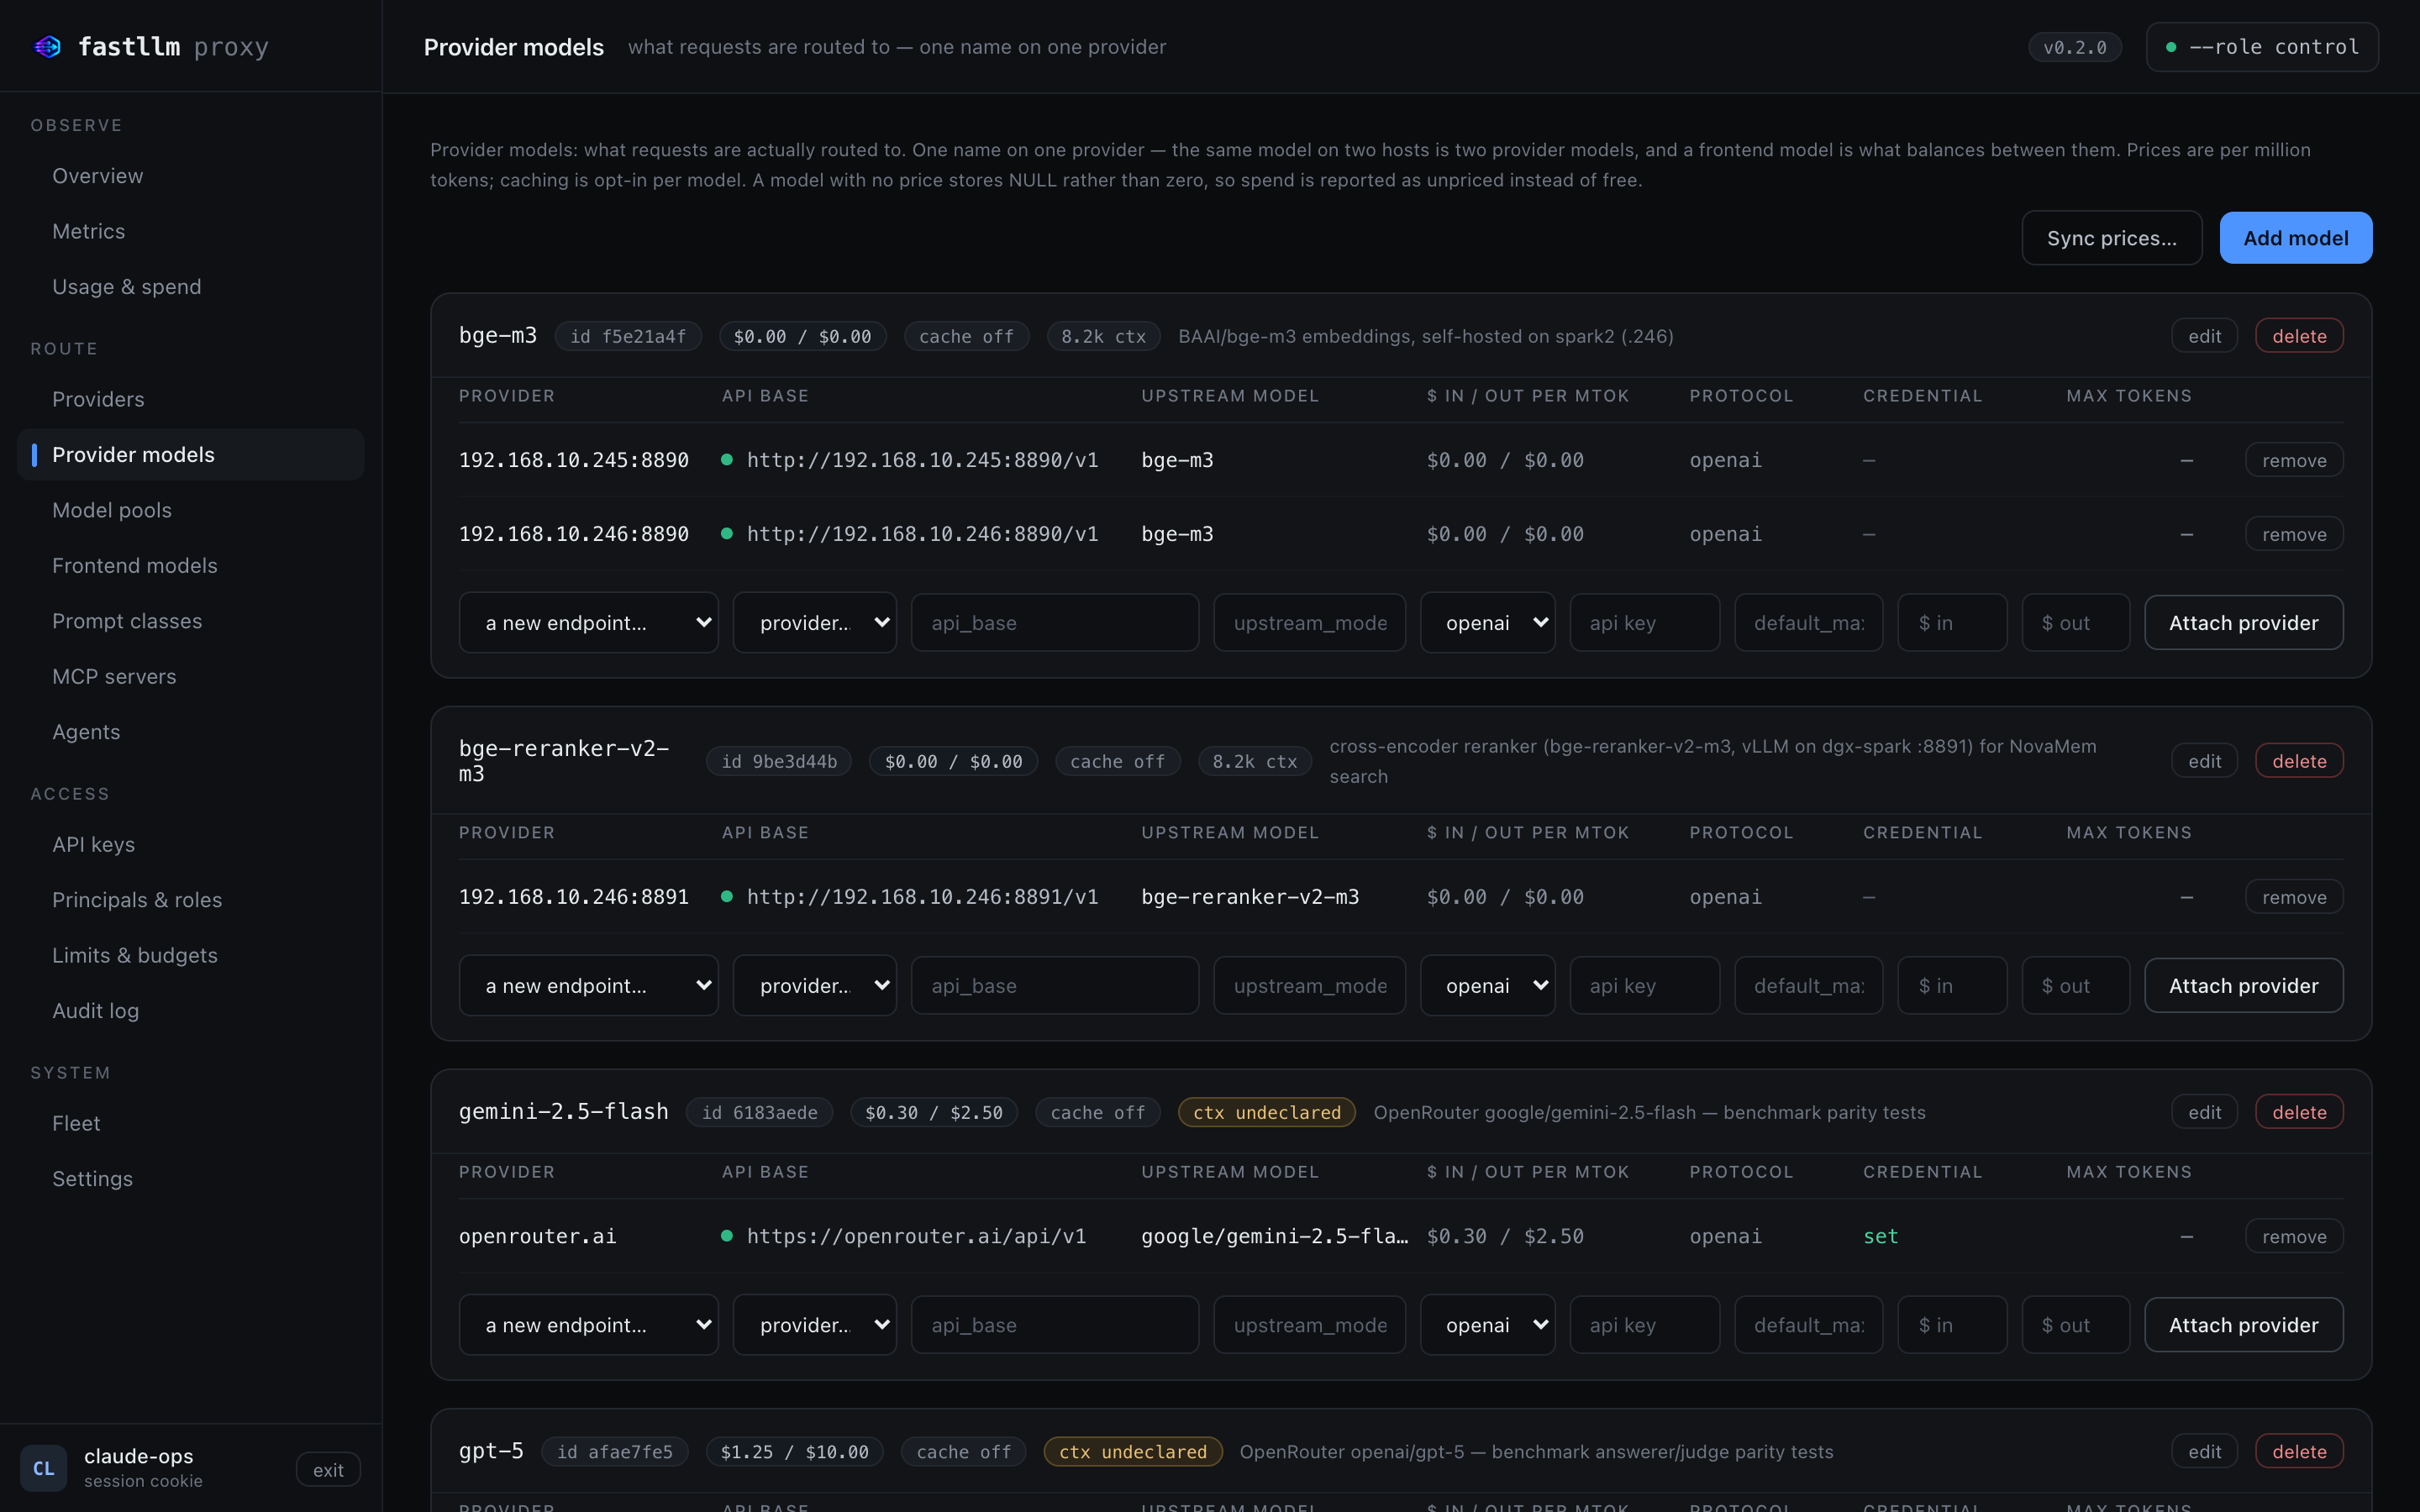
Each row shows what a client needs to know and what an operator needs to decide: the backends behind the name, whether a credential is set (never the credential itself), the price per million tokens, whether responses are cached, and the declared context window.
Or by API, if you would rather script it:
curl -sk -b /tmp/ck -X POST https://localhost:4001/admin/provider-models \
  -H 'content-type: application/json' -d '{"name":"my-model"}'          # -> {"id":N}

curl -sk -b /tmp/ck -X POST https://localhost:4001/admin/provider-models/N/backends \
  -H 'content-type: application/json' \
  -d '{"api_base":"http://localhost:8000/v1","upstream_model":"Qwen/Qwen3-8B"}'
4. Mint a key
Keys belong to principals — a person or a service — and a principal's roles decide which models it may invoke.
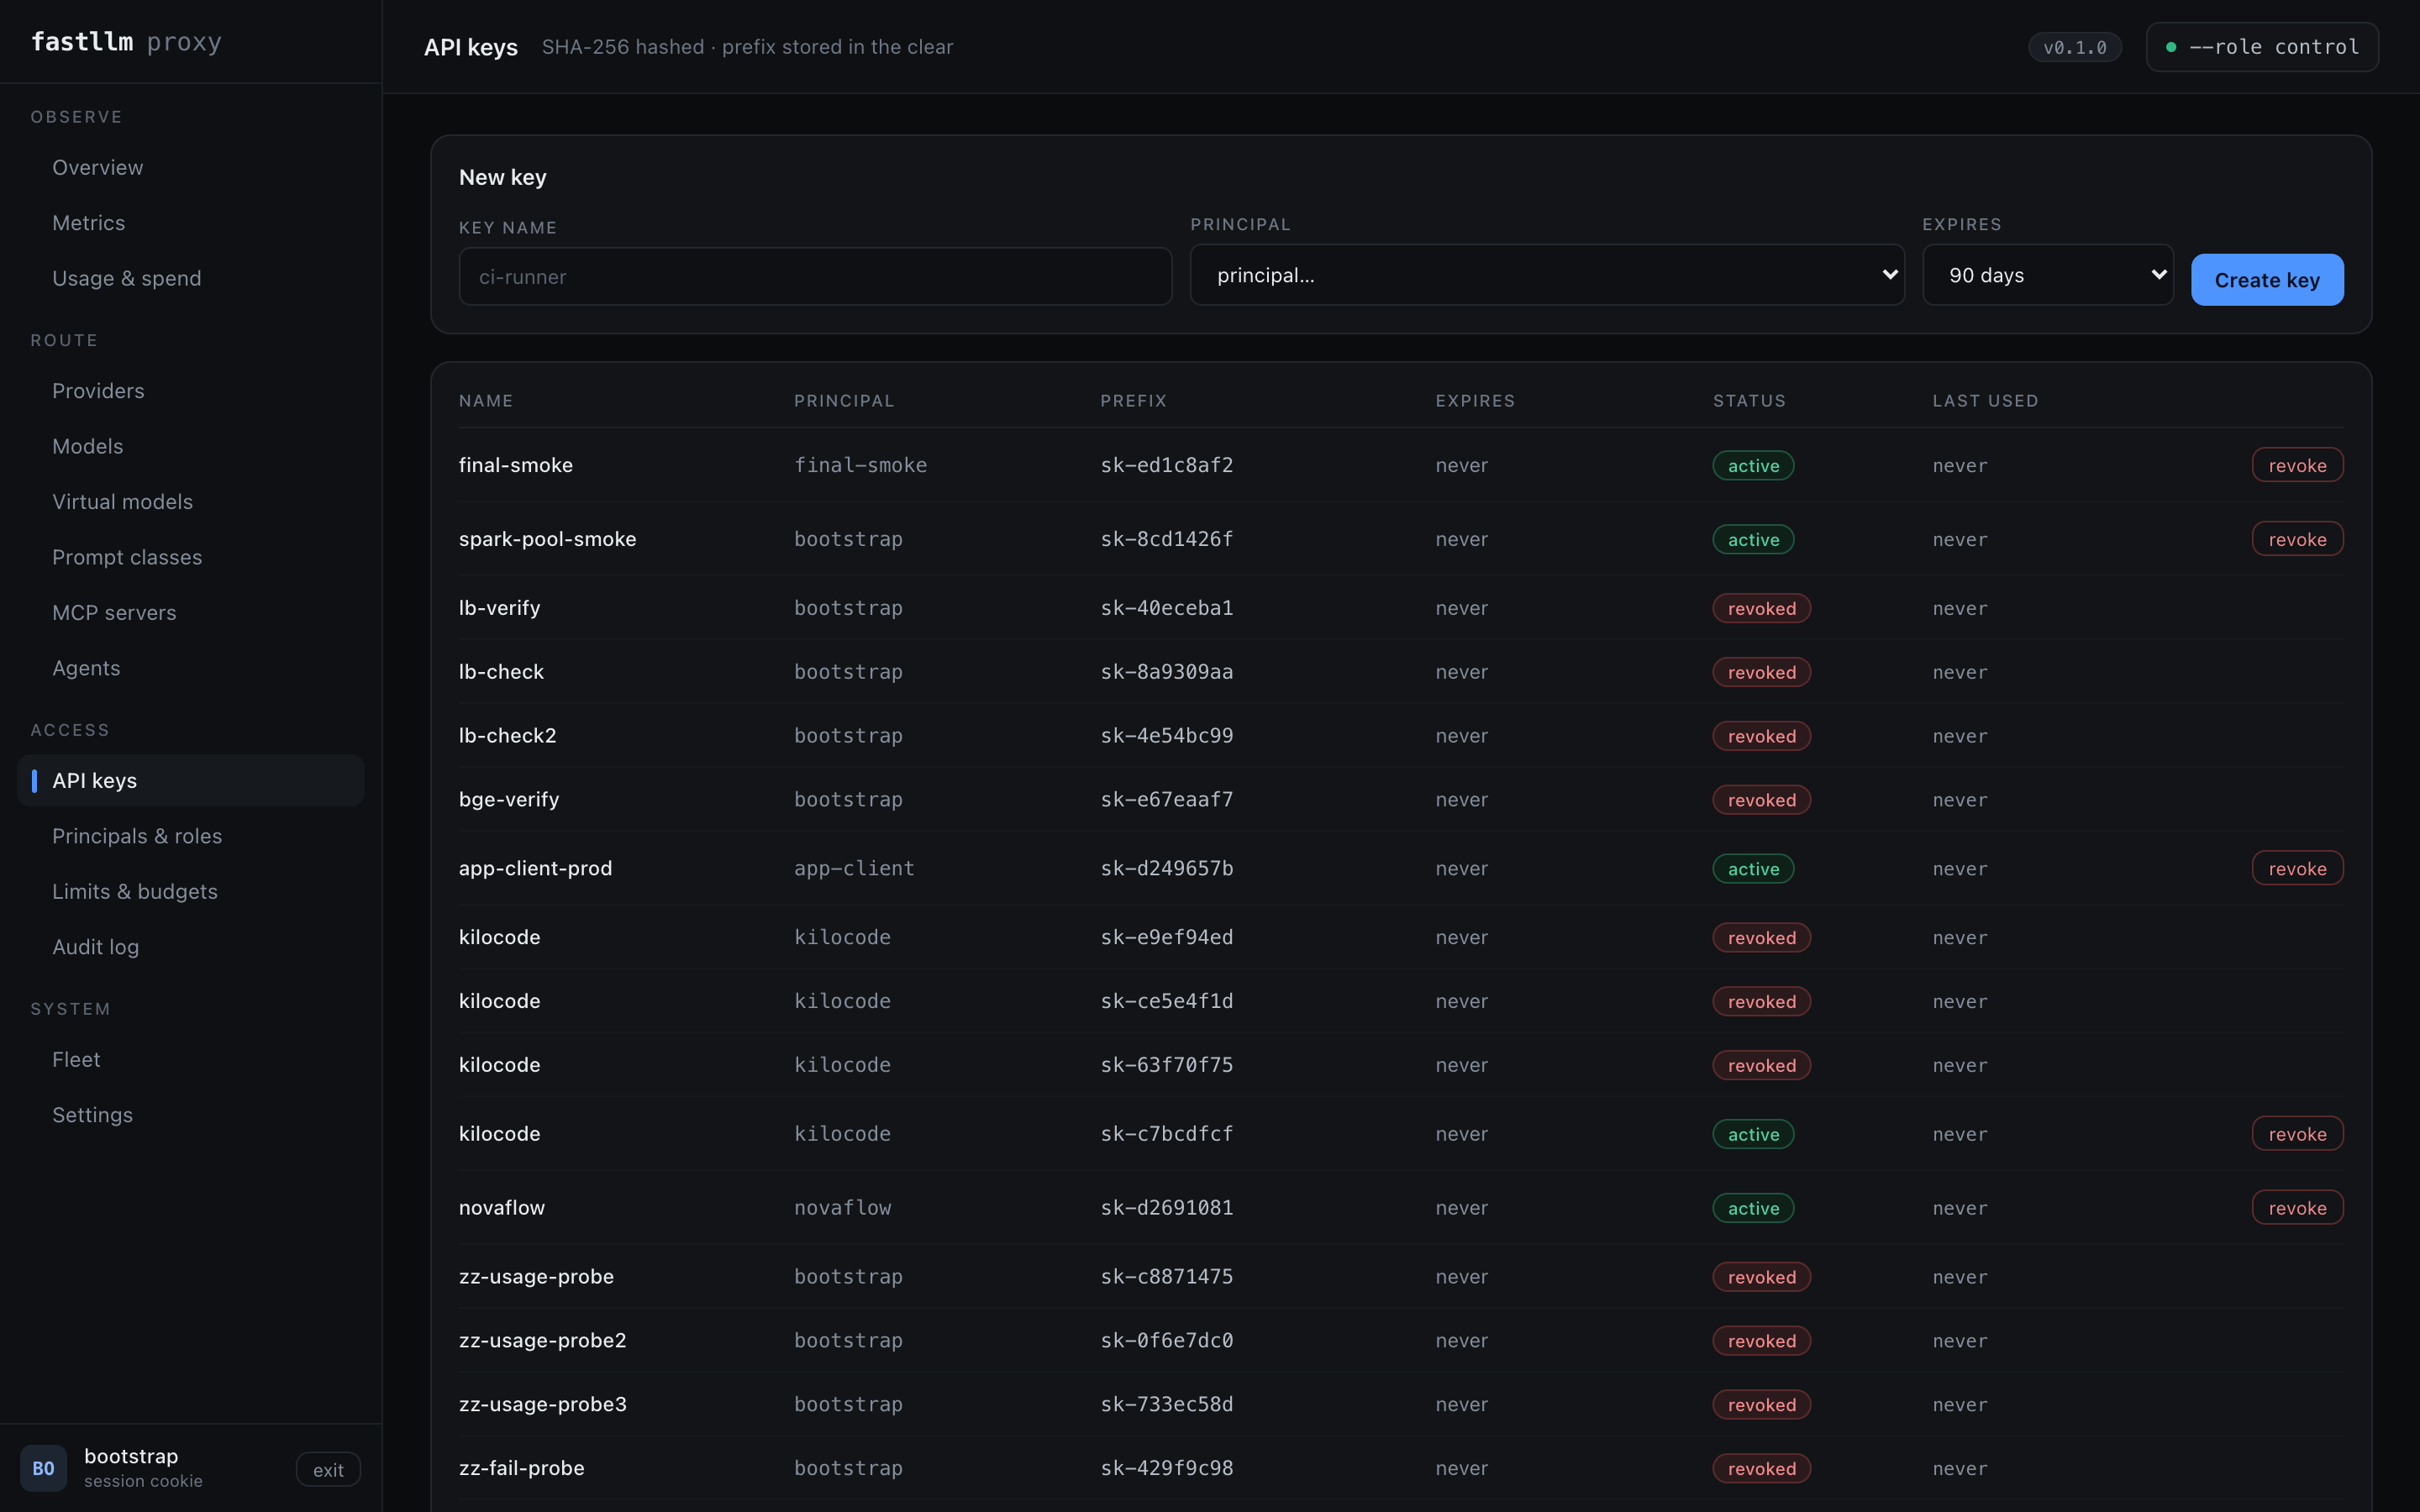
The plaintext is shown once and never again; only a SHA-256 hash and the prefix are stored. The expiry defaults to 90 days rather than never, which is the safer default and worth noticing before you wire it into something.
A new principal holds no grants at all, so its key authenticates and then gets
403 model_access_denied on everything. Give it a role on Principals &
roles first.
5. Make a request
curl http://localhost:4000/v1/chat/completions \
  -H "authorization: Bearer sk-..." -H 'content-type: application/json' \
  -d '{"model":"my-model","messages":[{"role":"user","content":"hi"}]}'
That is the whole integration for anything that speaks OpenAI. Point your SDK,
editor or agent at http://localhost:4000/v1 — see
Connecting a client for the exact config for the OpenAI
SDKs, five coding agents and four frameworks.
Already running LiteLLM?
Skip all of the above:
fastllm-proxy import --config litellm_config.yaml --database-url postgres://...
Models, backends, keys and each key's per-model grants come across. It is idempotent — re-importing an edited file converges rather than duplicating, and grants removed from the file are revoked. Your existing keys keep working against the same models they already had.
Where next
| A tour of the UI | Every screen, what it answers, and the one thing on it worth knowing |
| Connecting a client | SDKs, coding agents, frameworks, observability |
| Troubleshooting | The failures people actually hit |
A tour of the UI
Sixteen screens, embedded in the binary, and a seventeenth that appears only under the Kubernetes operator. What each one answers, and the one thing on it worth knowing before you trust it.
Overview — is it healthy, and what has it been doing
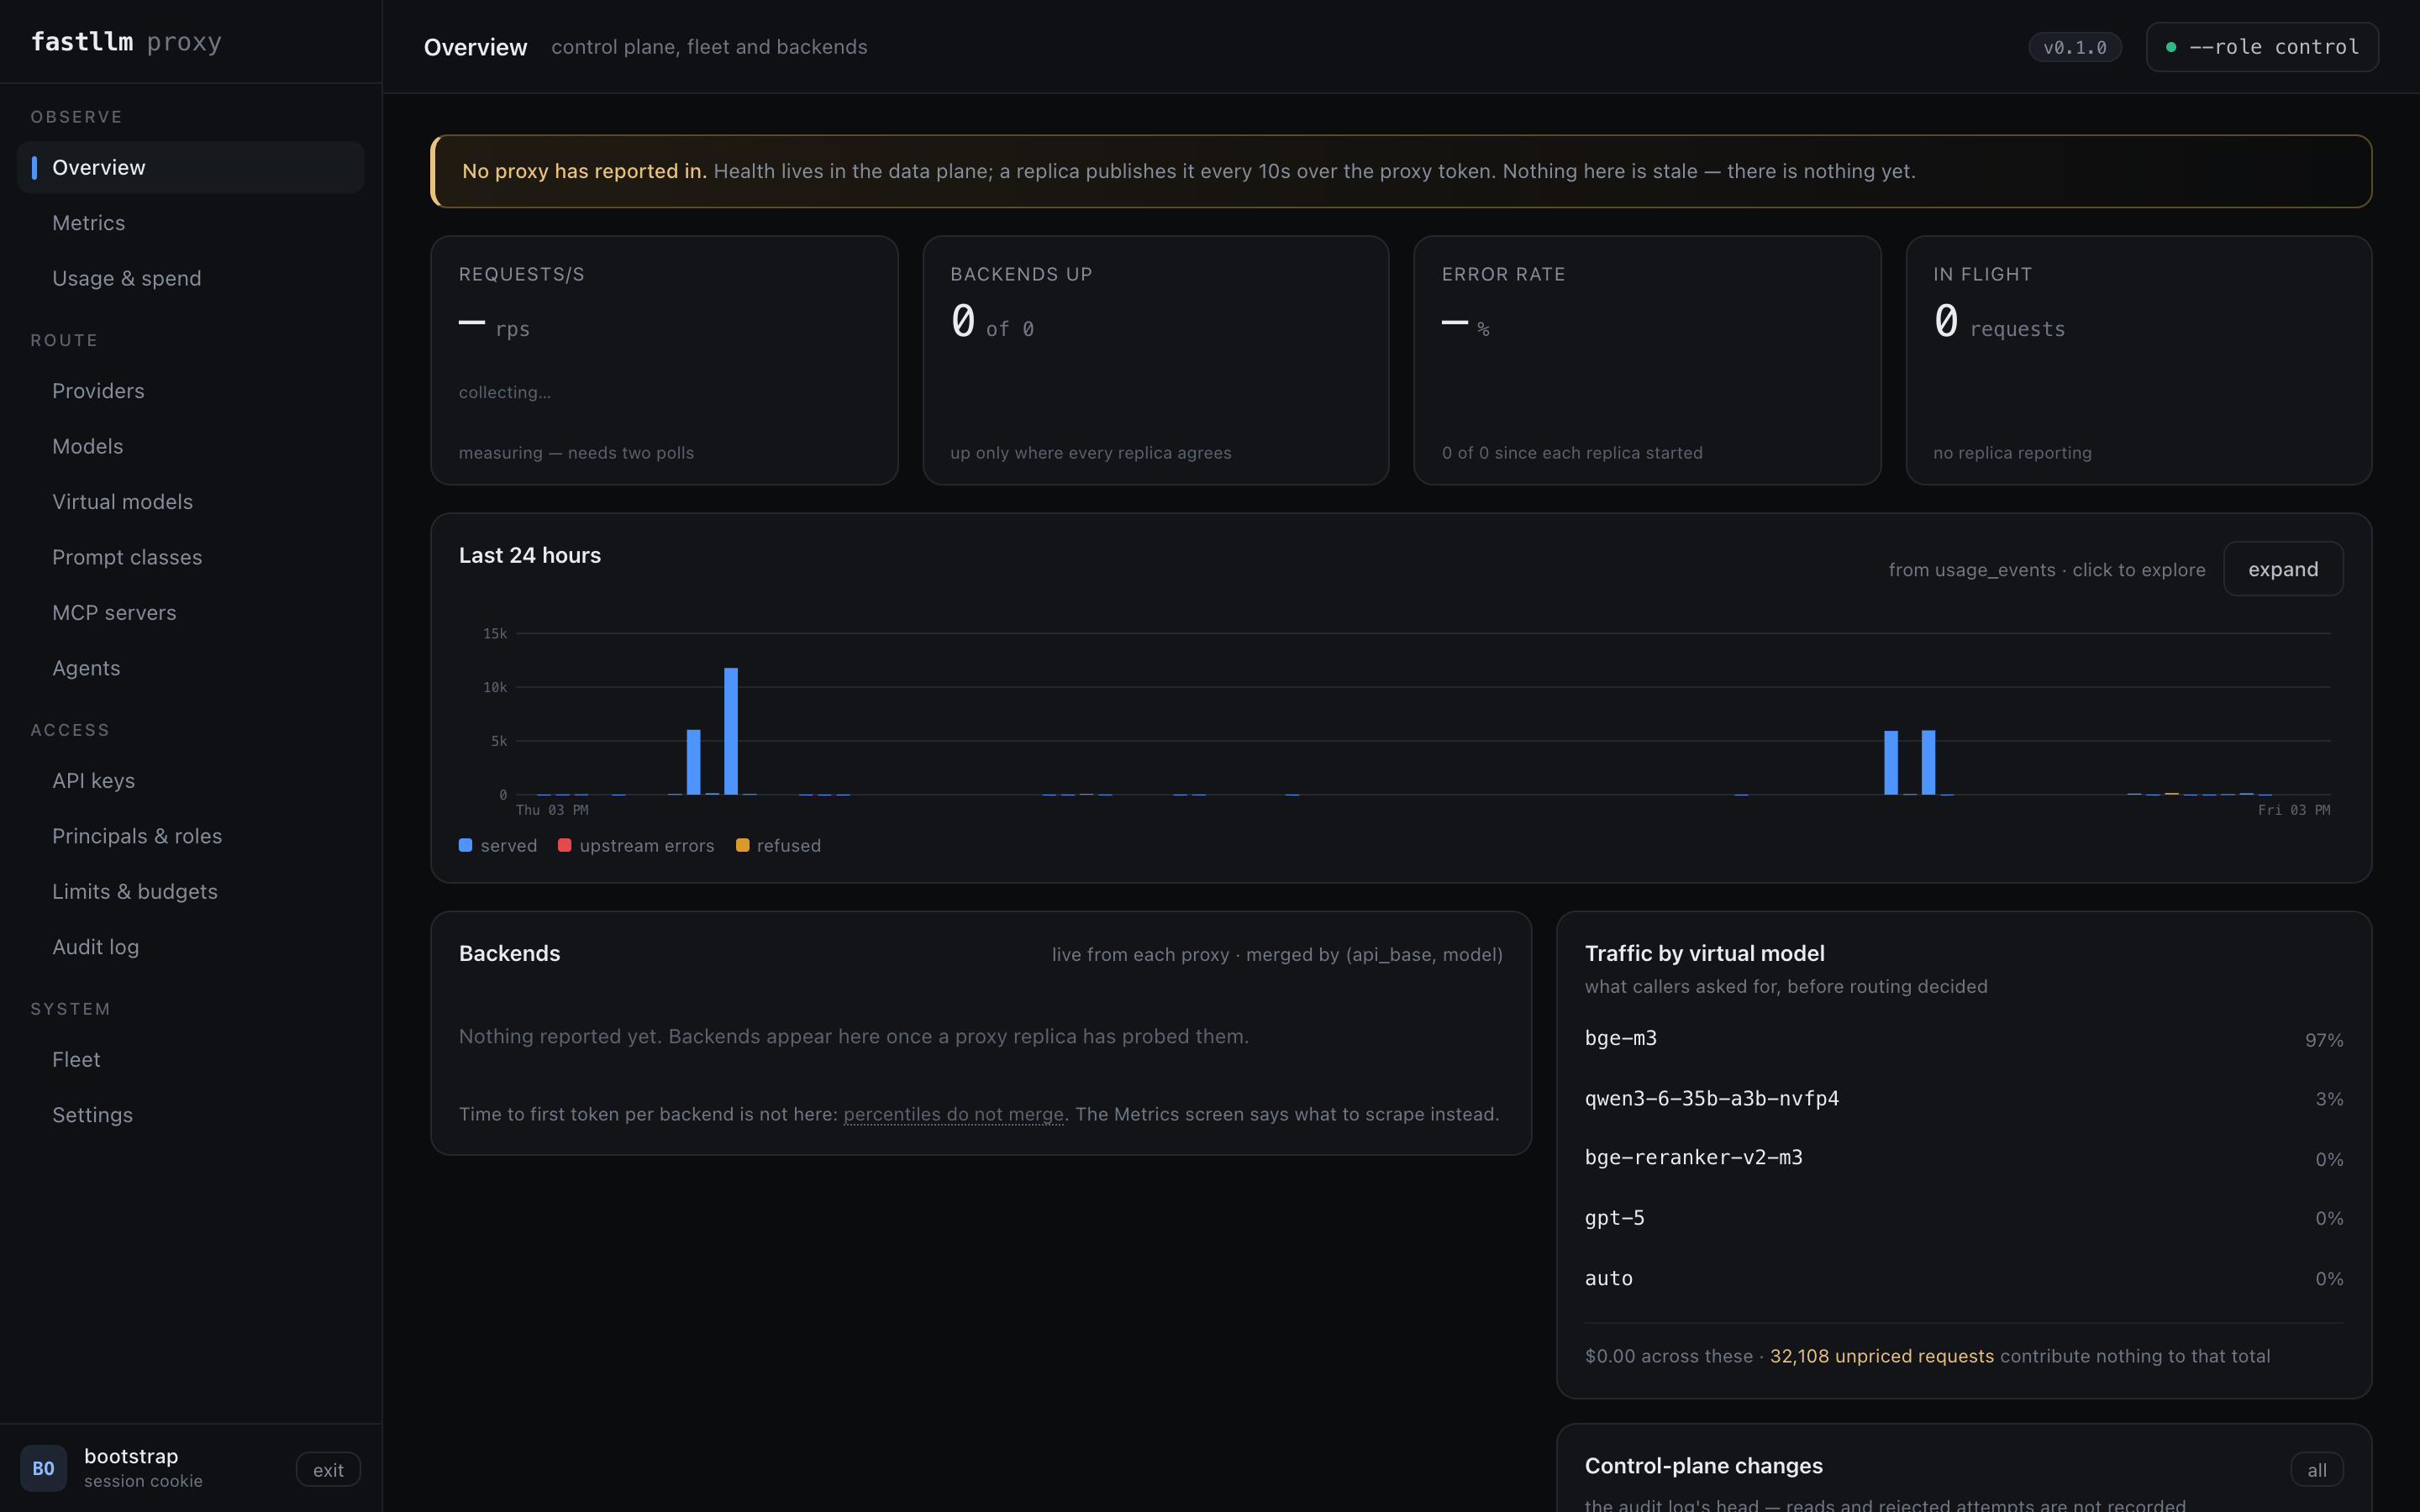
The four tiles are measured live by the page. The chart underneath is read from the database, so it survives a reload and answers "was it like this an hour ago" — a question the tiles cannot.
Backends is per replica and never merged. If one replica reports a backend down and the others do not, that is a partition rather than a dead backend, and averaging them together would delete the only symptom.
Click the chart for the drill-down:
Five ranges, pan backwards through history, filter by model or principal. Requests are stacked as served / upstream errors / refusals-by-kind, because a caller stopped by a budget and a backend that fell over need different people to do different things. A gap in the latency line is a bucket with nothing to measure — not zero.
Metrics — what is happening right now
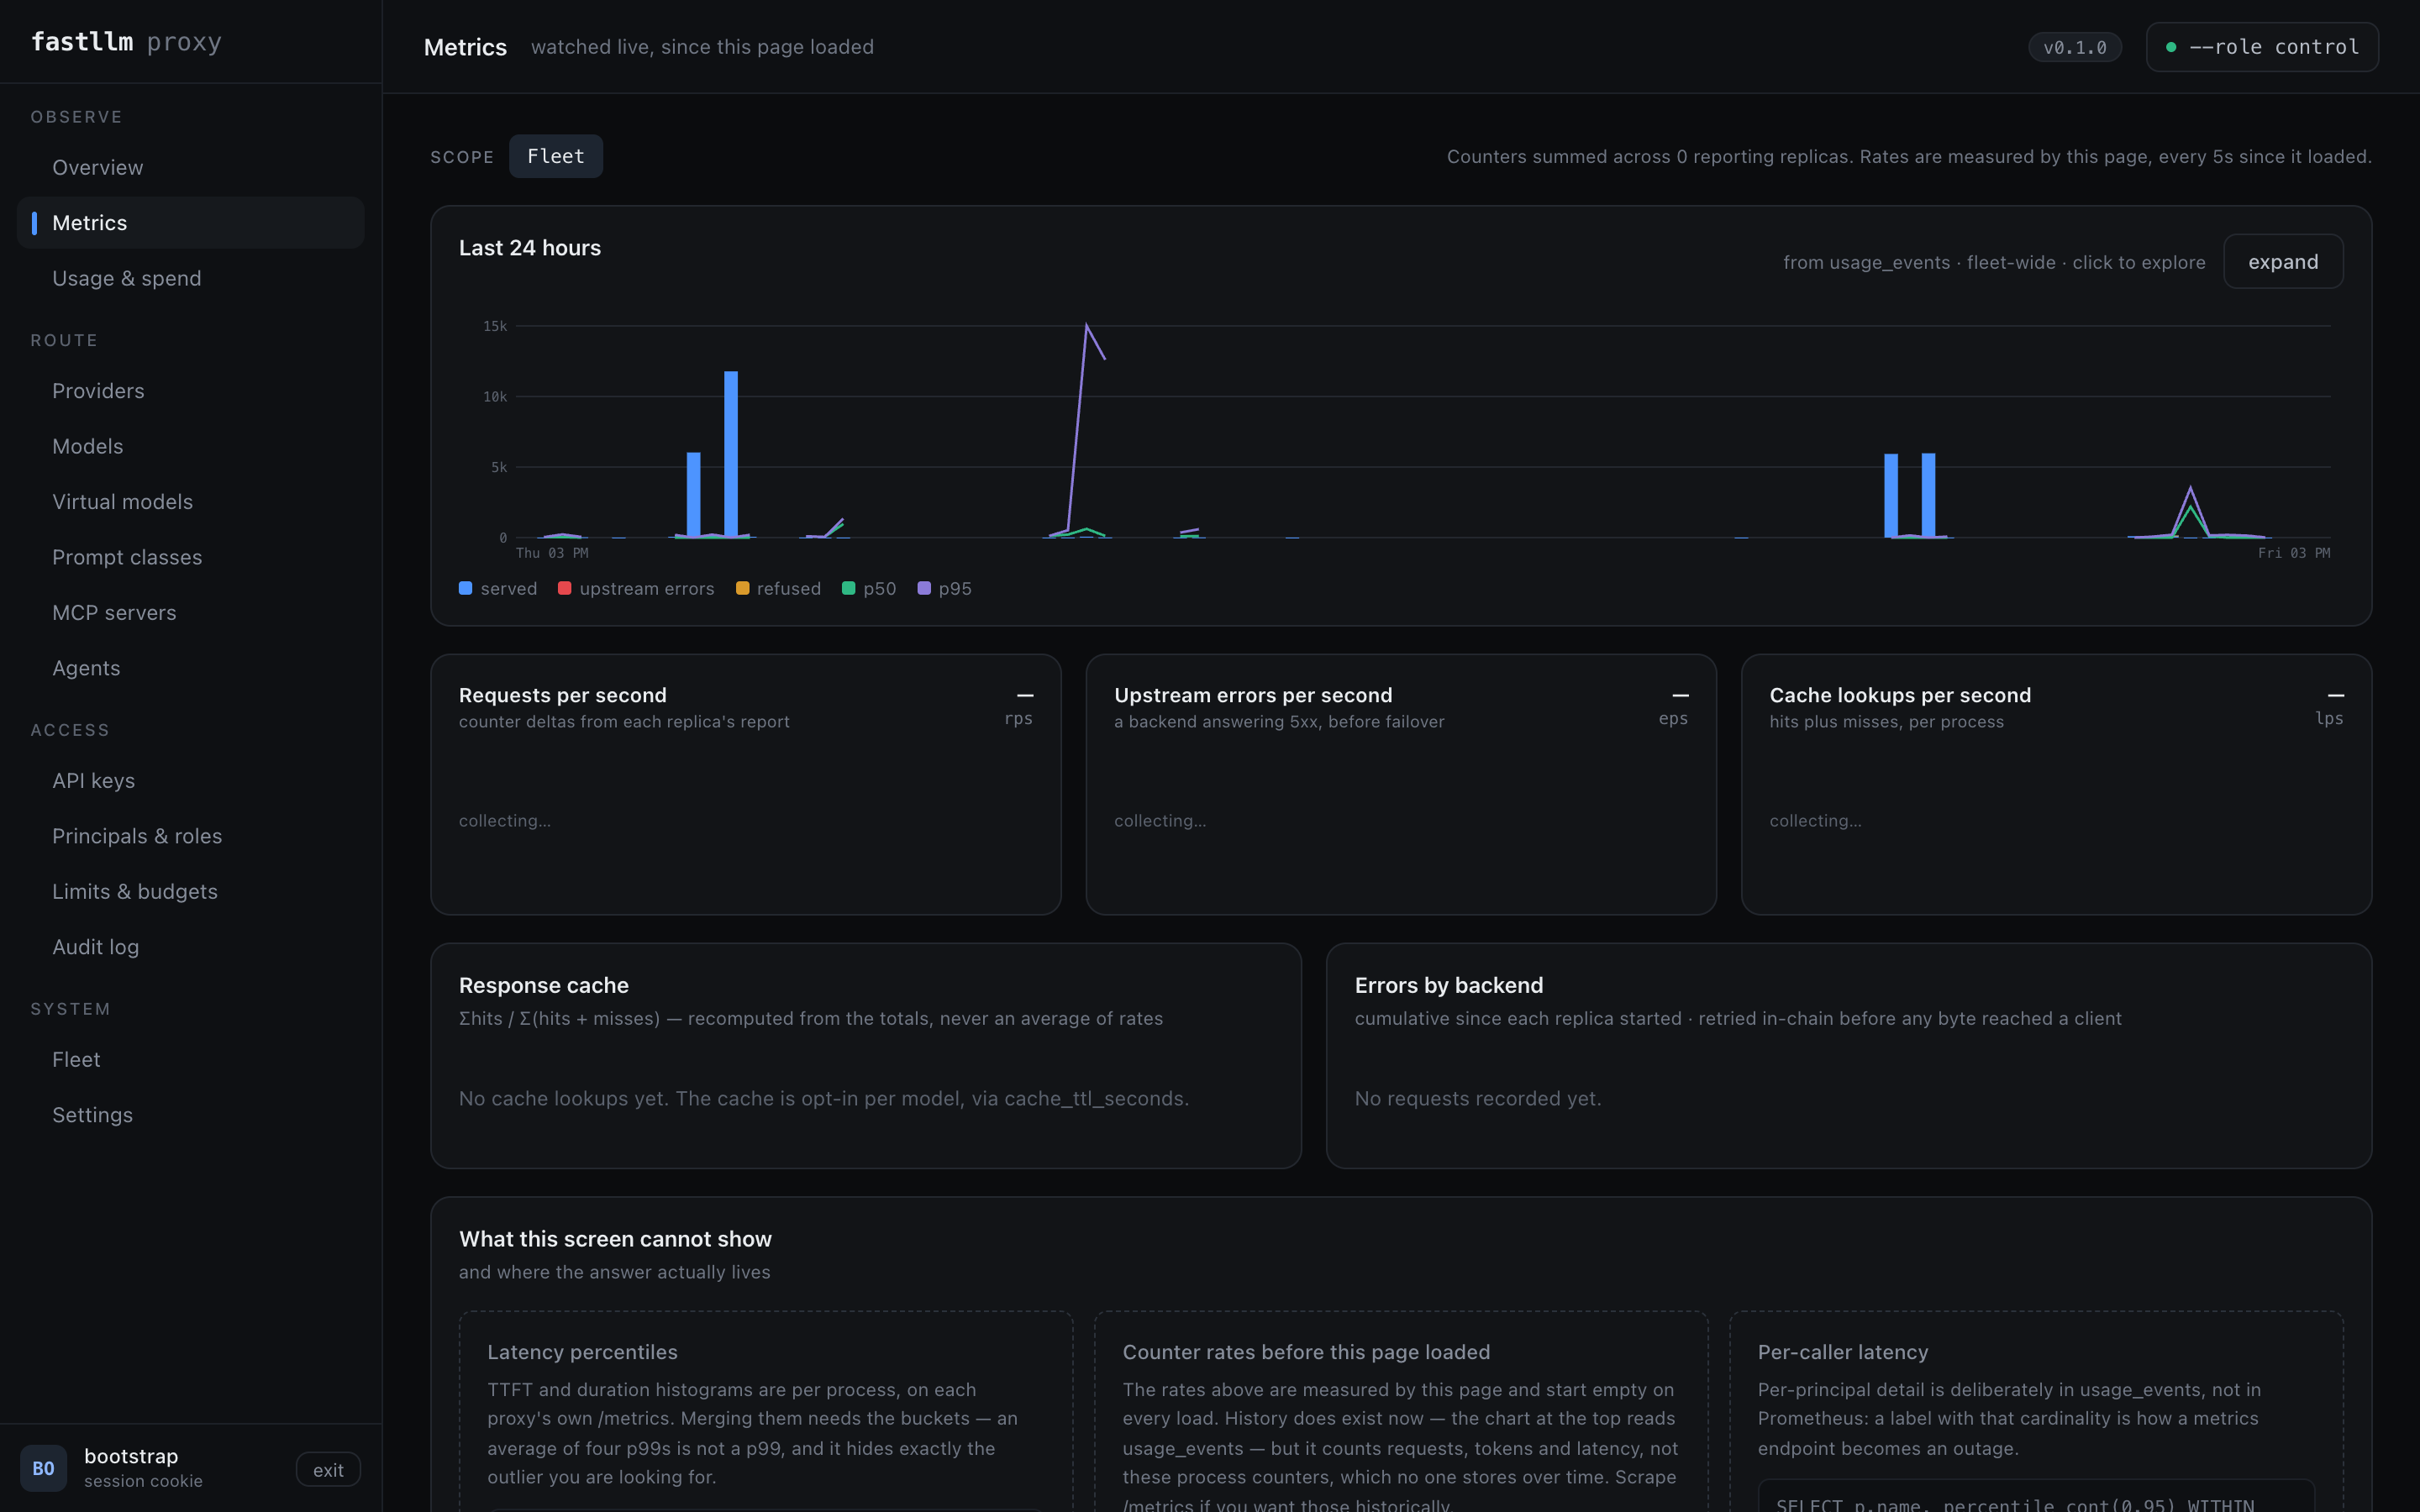
Rates measured by the page since it loaded, scoped to the fleet or to one replica. Percentiles are shown per replica and never merged: the average of four p99s is not a p99, and the screen says so rather than quietly averaging.
Usage & spend — who used what, and what it cost
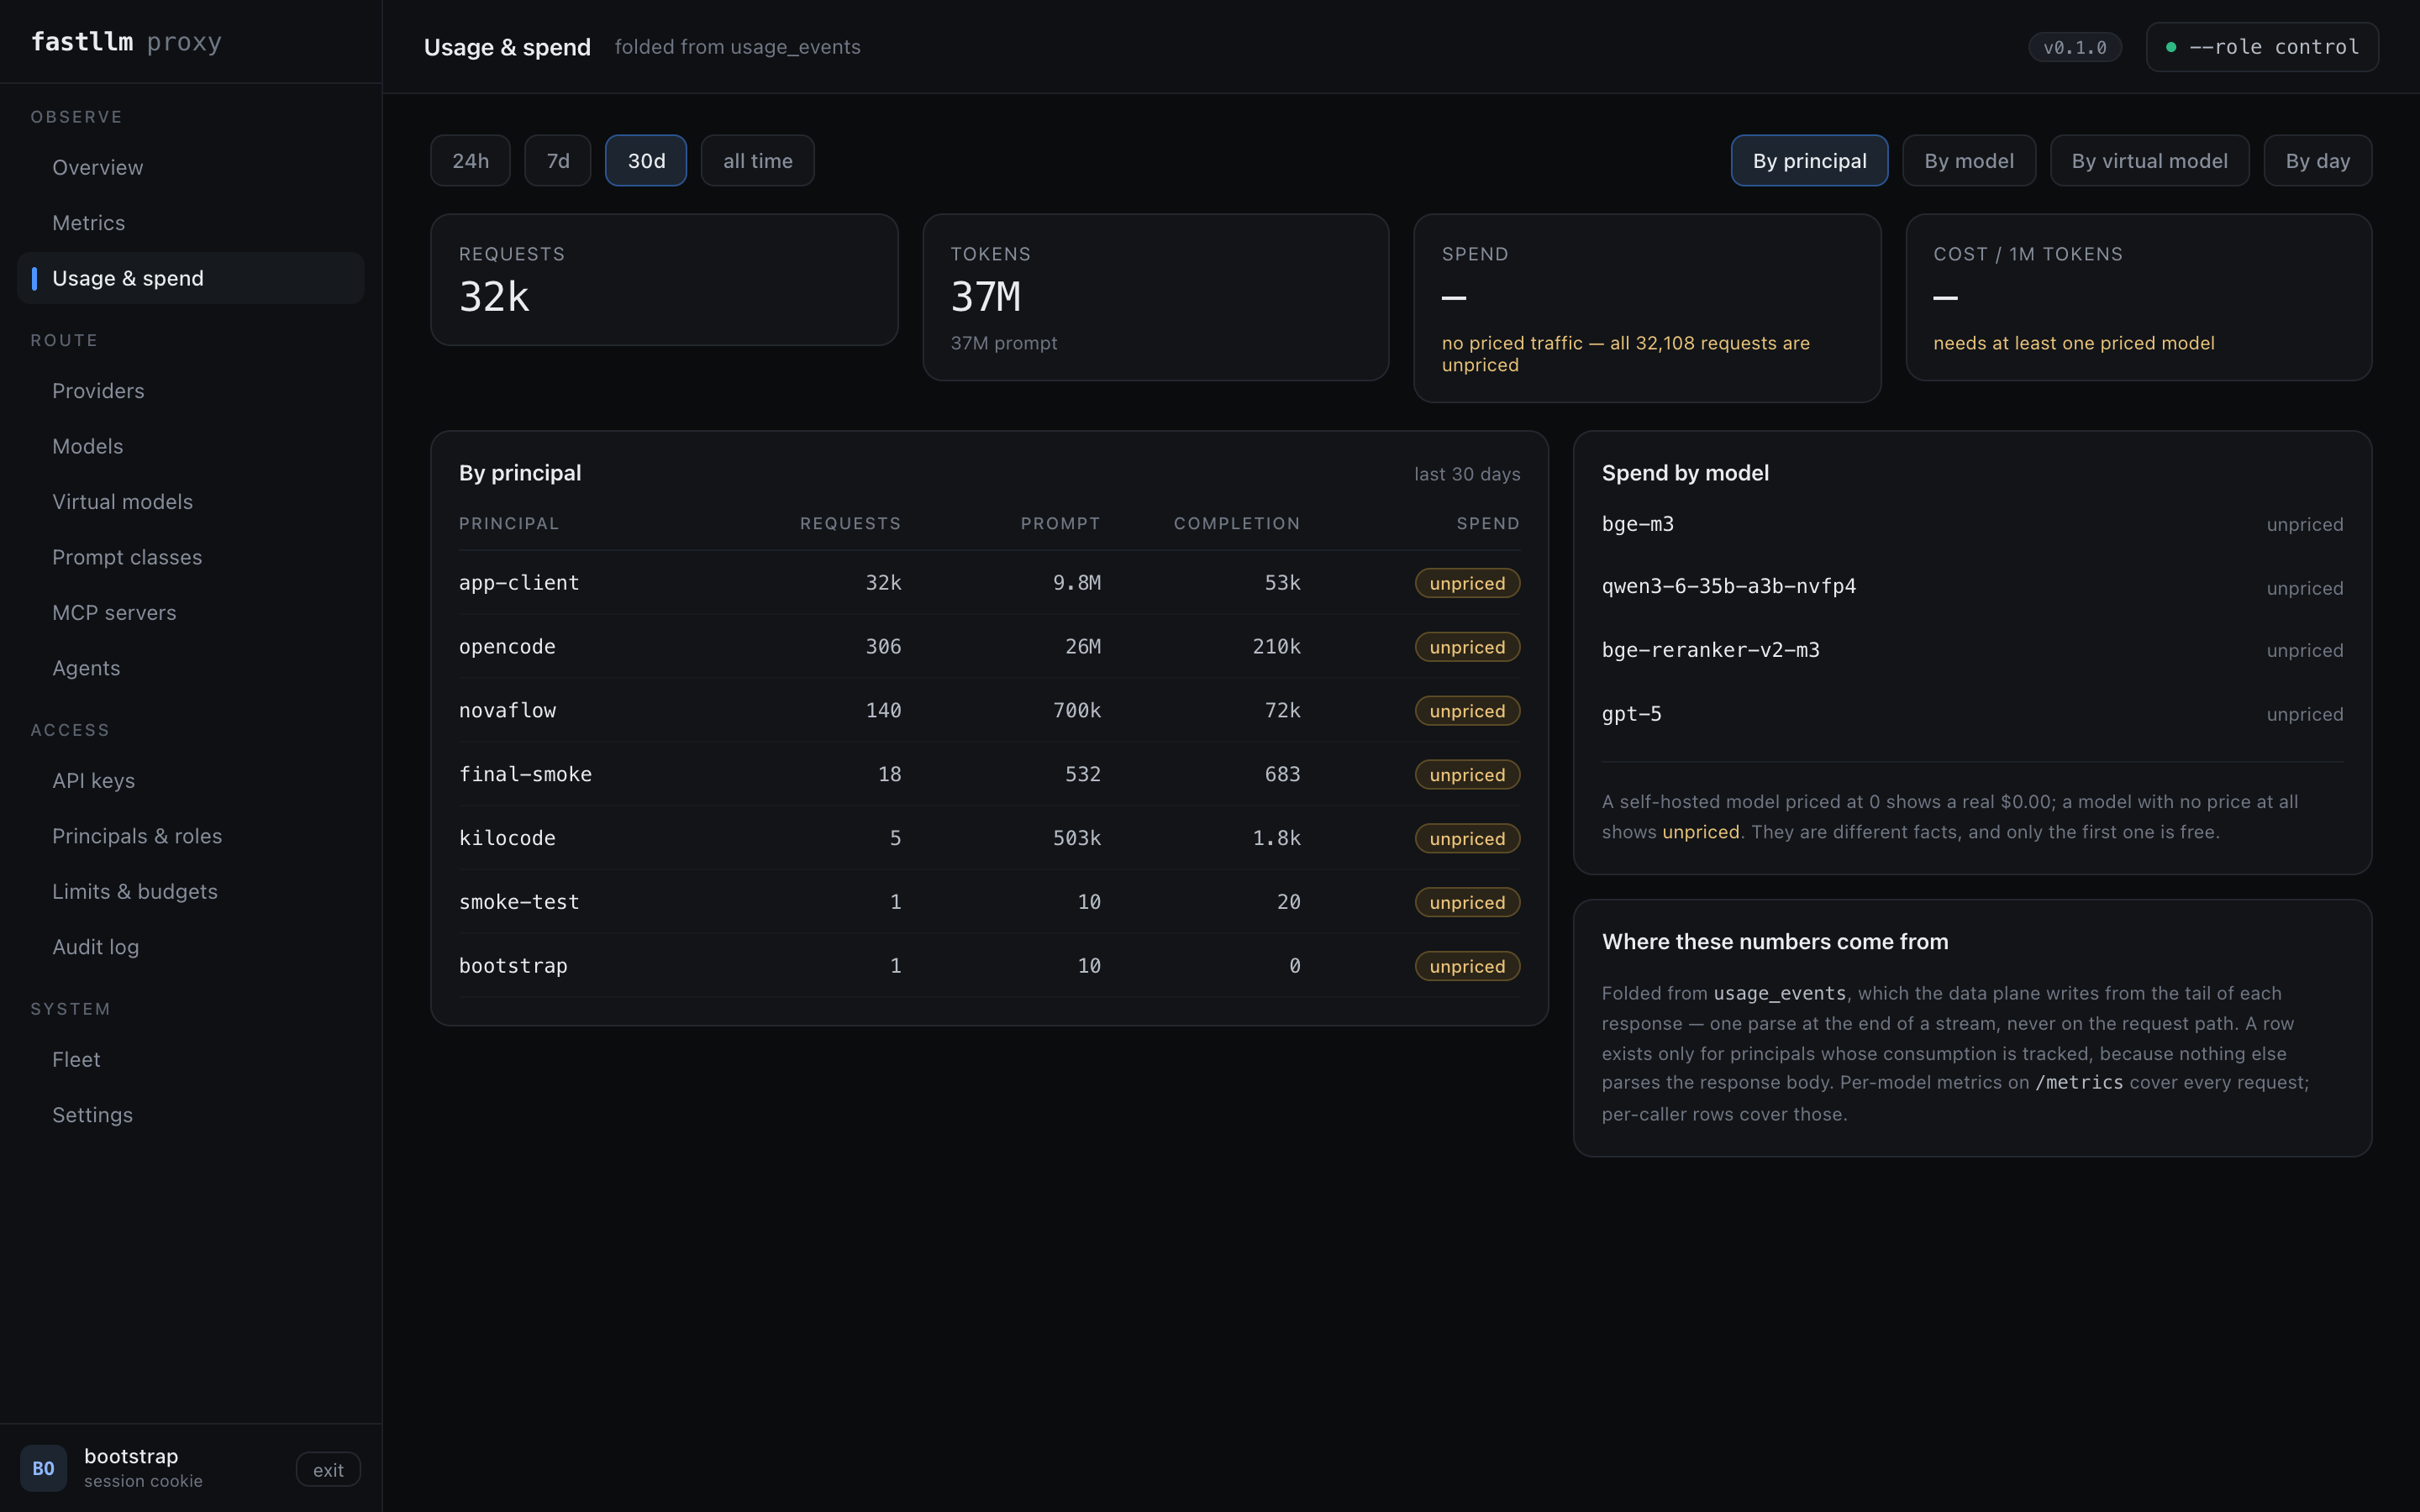
Folded from usage_events, one row per request. A model with no price
contributes nothing to spend and is counted as unpriced rather than as zero,
so a spend figure never quietly understates.
Model pools — one model, the providers you choose
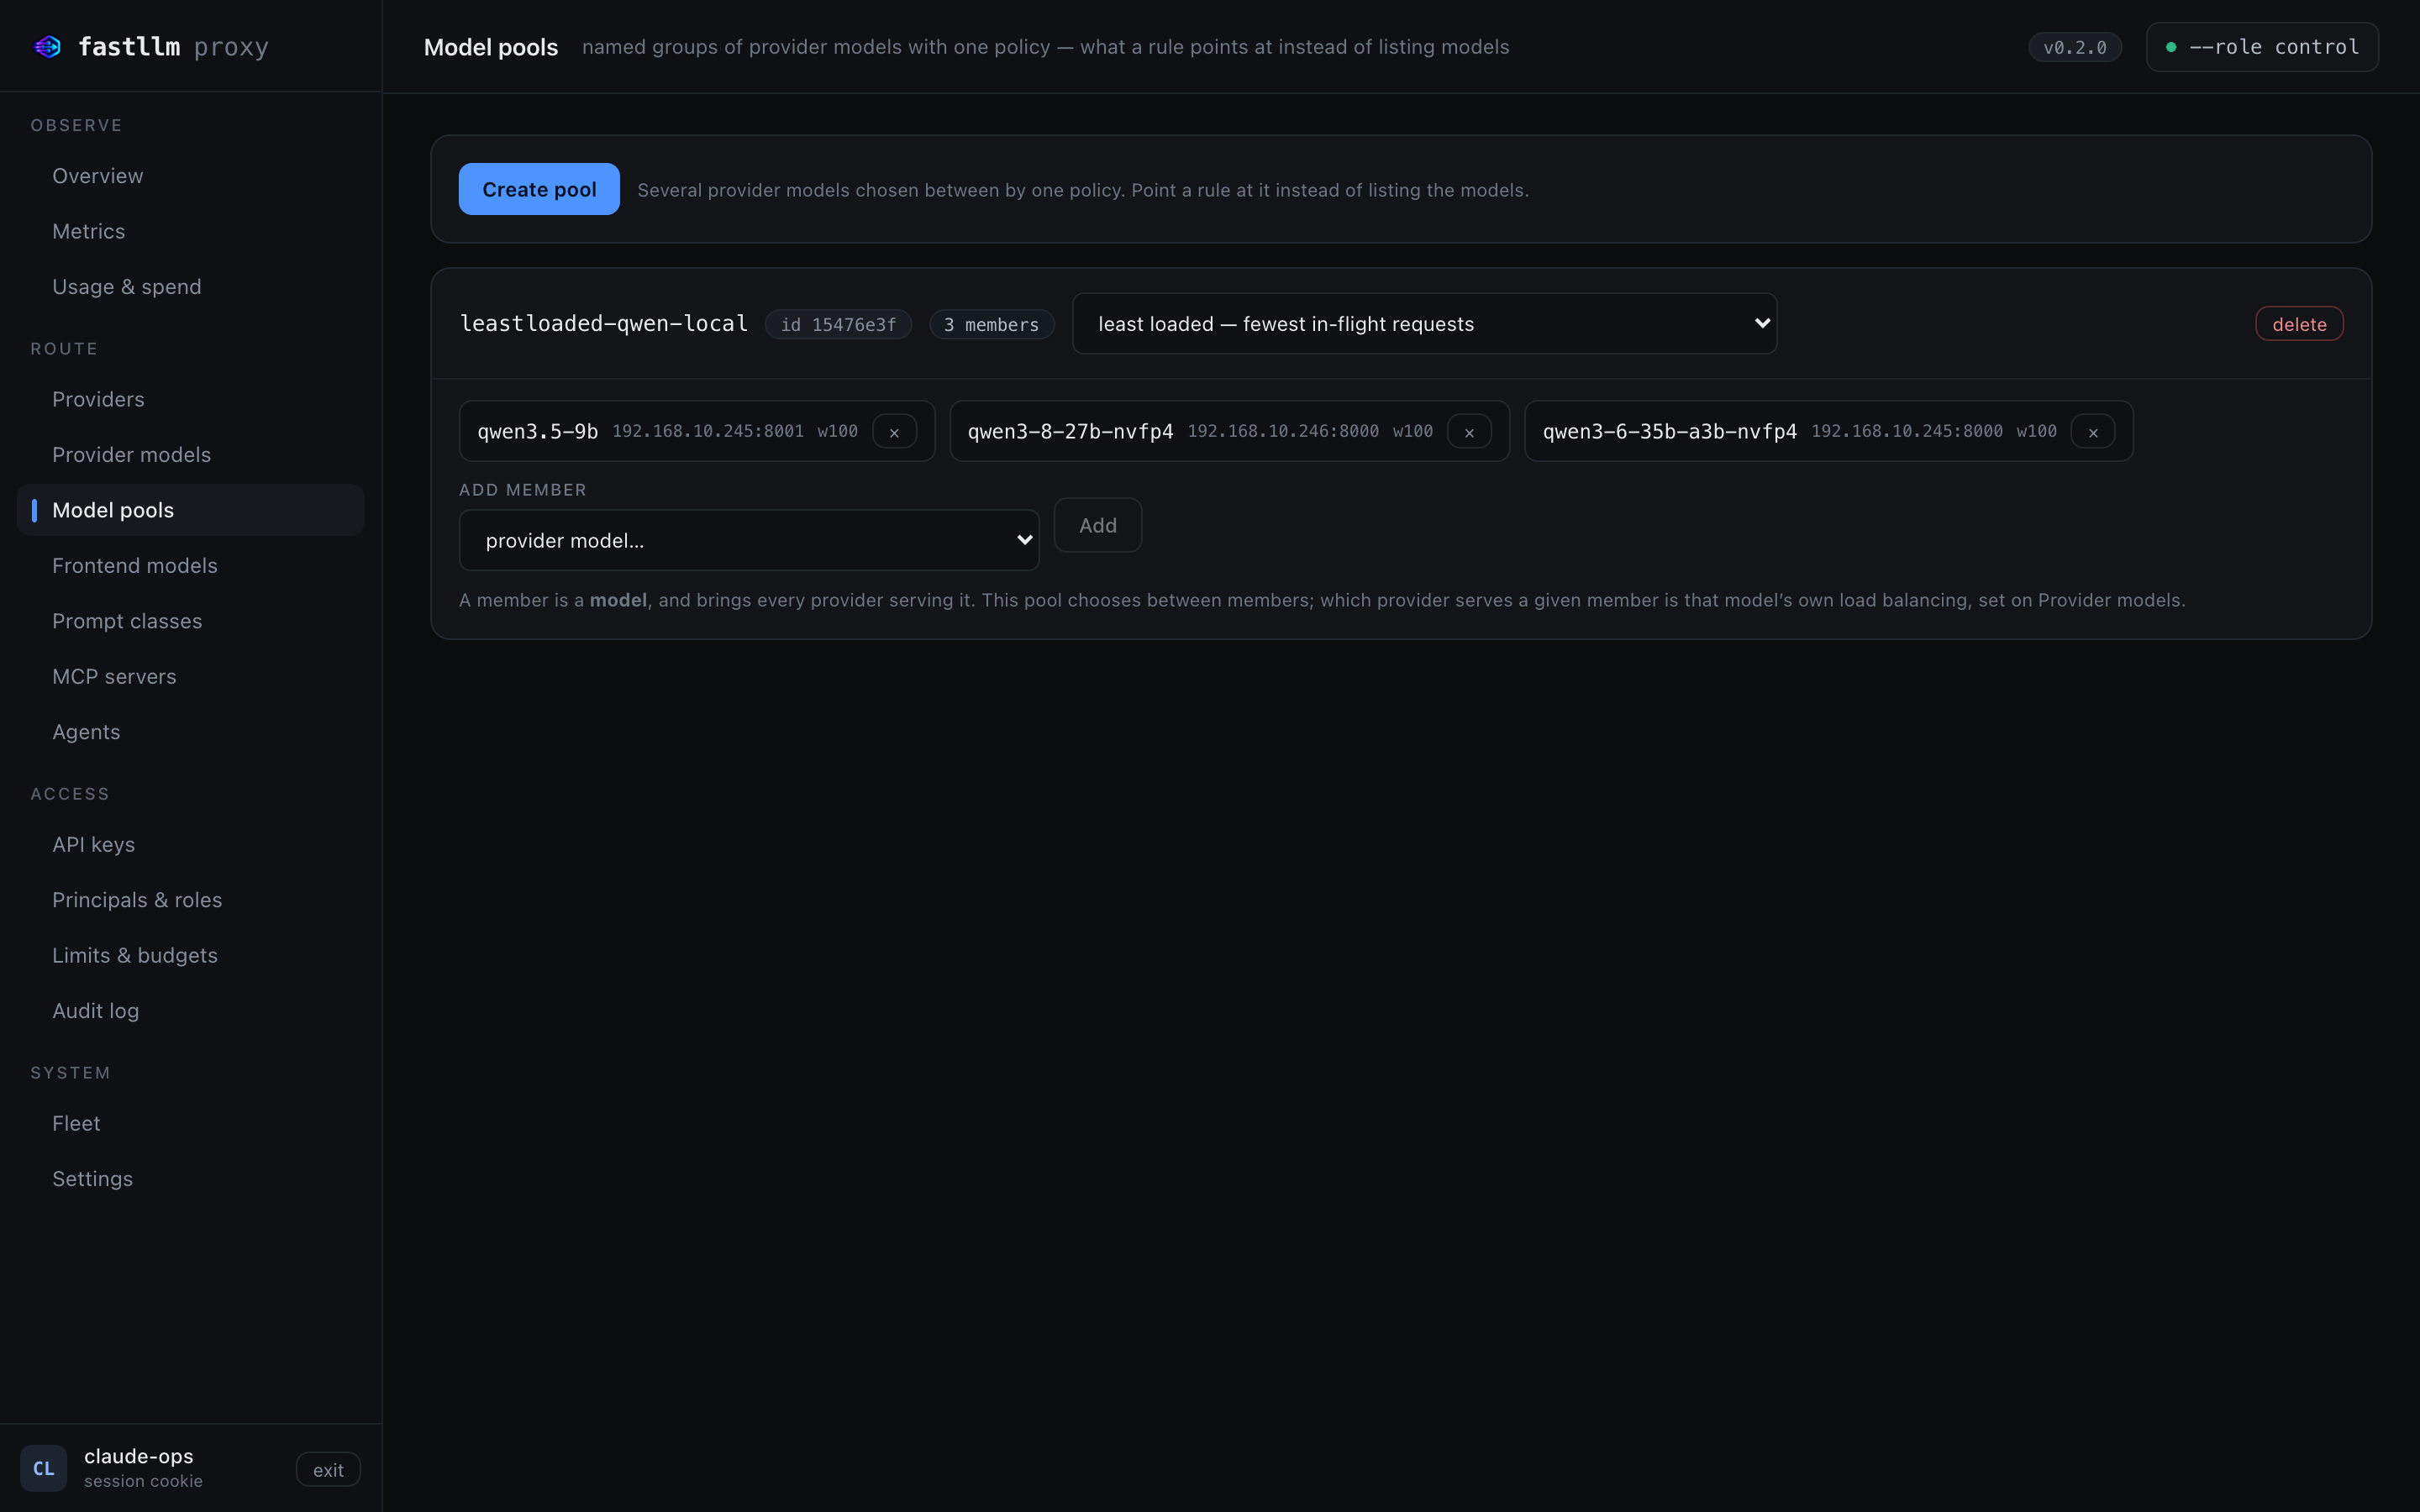
A pool is one model, a chosen subset of the providers serving it, and the policy that picks between them per request — least-loaded, fastest, prefix-affinity, or a weighted split. Choose the model first and its providers are listed one row each, so a pool can balance across two of the three machines serving a model and leave the third alone.
Such a pool is published as a routable model of its own, carrying exactly the ticked attachments and the pool's policy. That is what makes the subset mean anything at dispatch, and it leaves the model itself untouched: it still carries every provider, so everything else routing through it is unaffected.
Frontend model rules choose a pool the same way they choose a single model, and the same model can sit in several pools under different policies.
Cheapest is deliberately not a policy here: choosing on price is a routing decision made before a target is picked, not a way of balancing within one.
Usage rows for a pool record the pool's name as the model, because the pool is what served the request; the exact backend is on the row either way.
Frontend models — one name, many targets
A client-facing name with ordered rules. The first rule whose conditions match wins; targets are weighted and ordered, so one rule is both a split and a failover chain. Conditions can be principal, role, prompt size, requested generation, streaming, headers, budget consumption, time of day, or semantic class.
Dry-run answers which rule would decide, and what the chain resolves to, without dispatching anything.
Prompt classes — routing on what the prompt is about
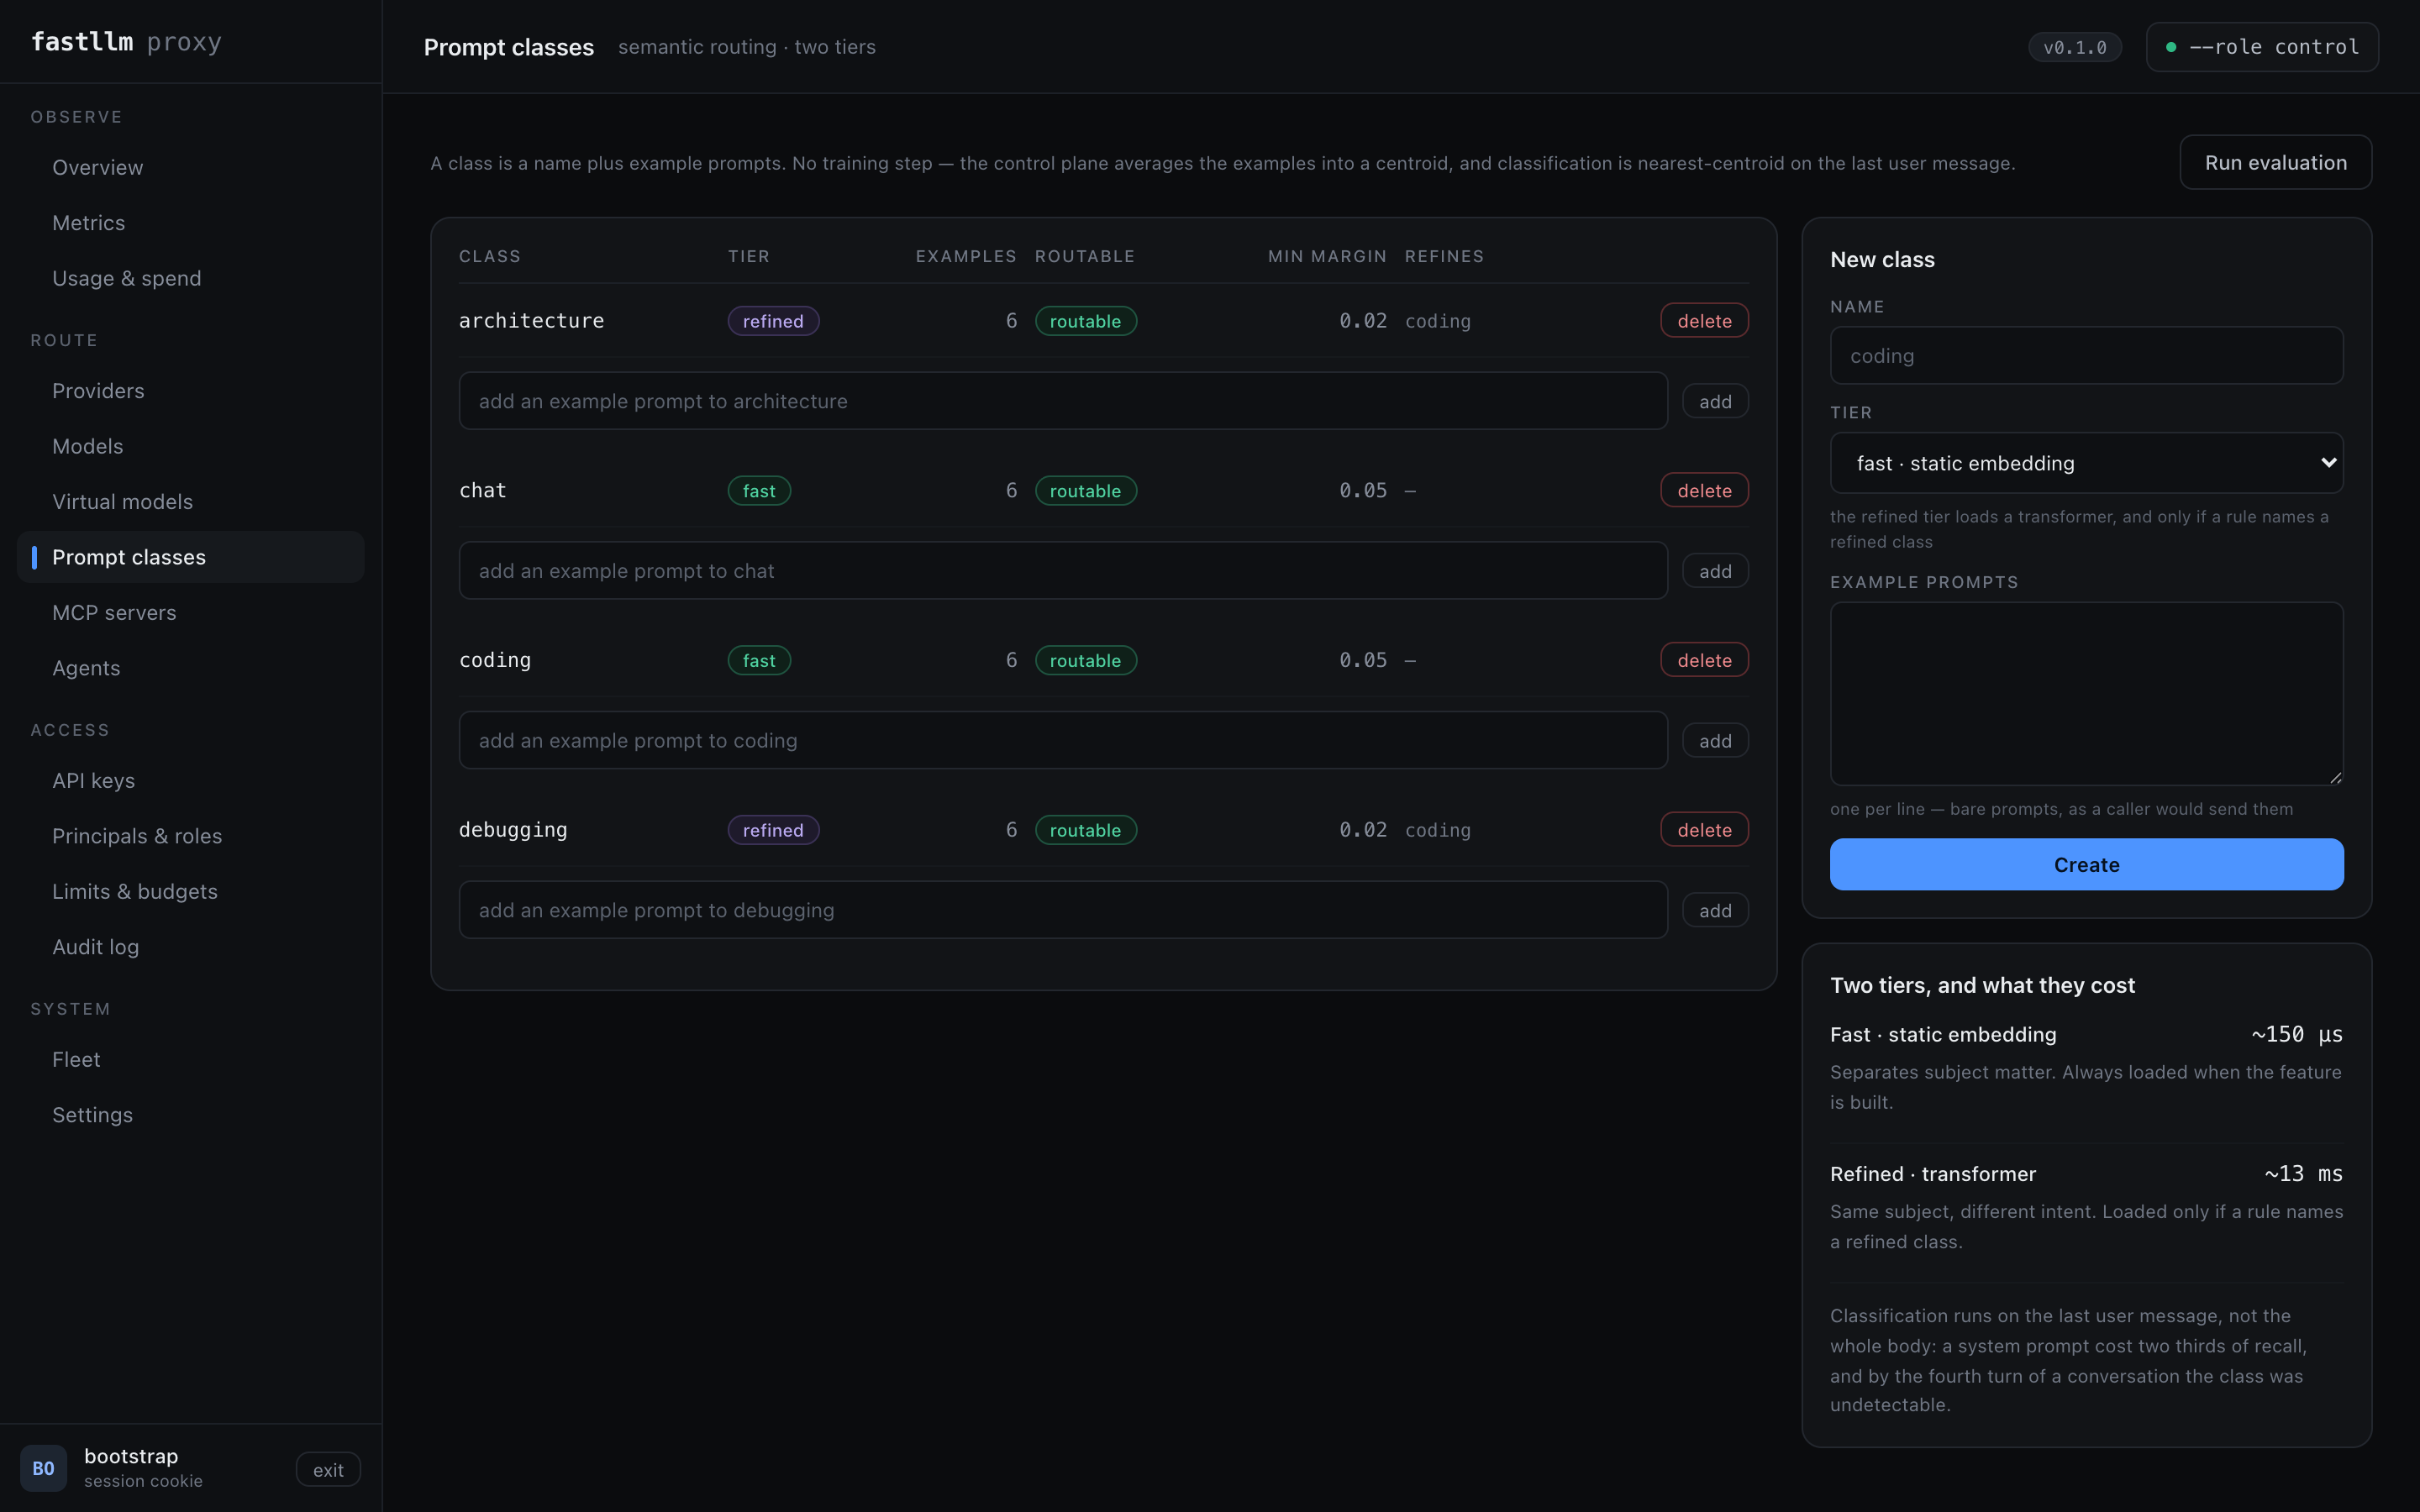
A class is a name plus example prompts; there is no training step. Run evaluation scores every example against centroids that exclude it, so the precision and recall it reports are not inflated by the example being inside its own centroid.
Principals & roles — who may invoke what
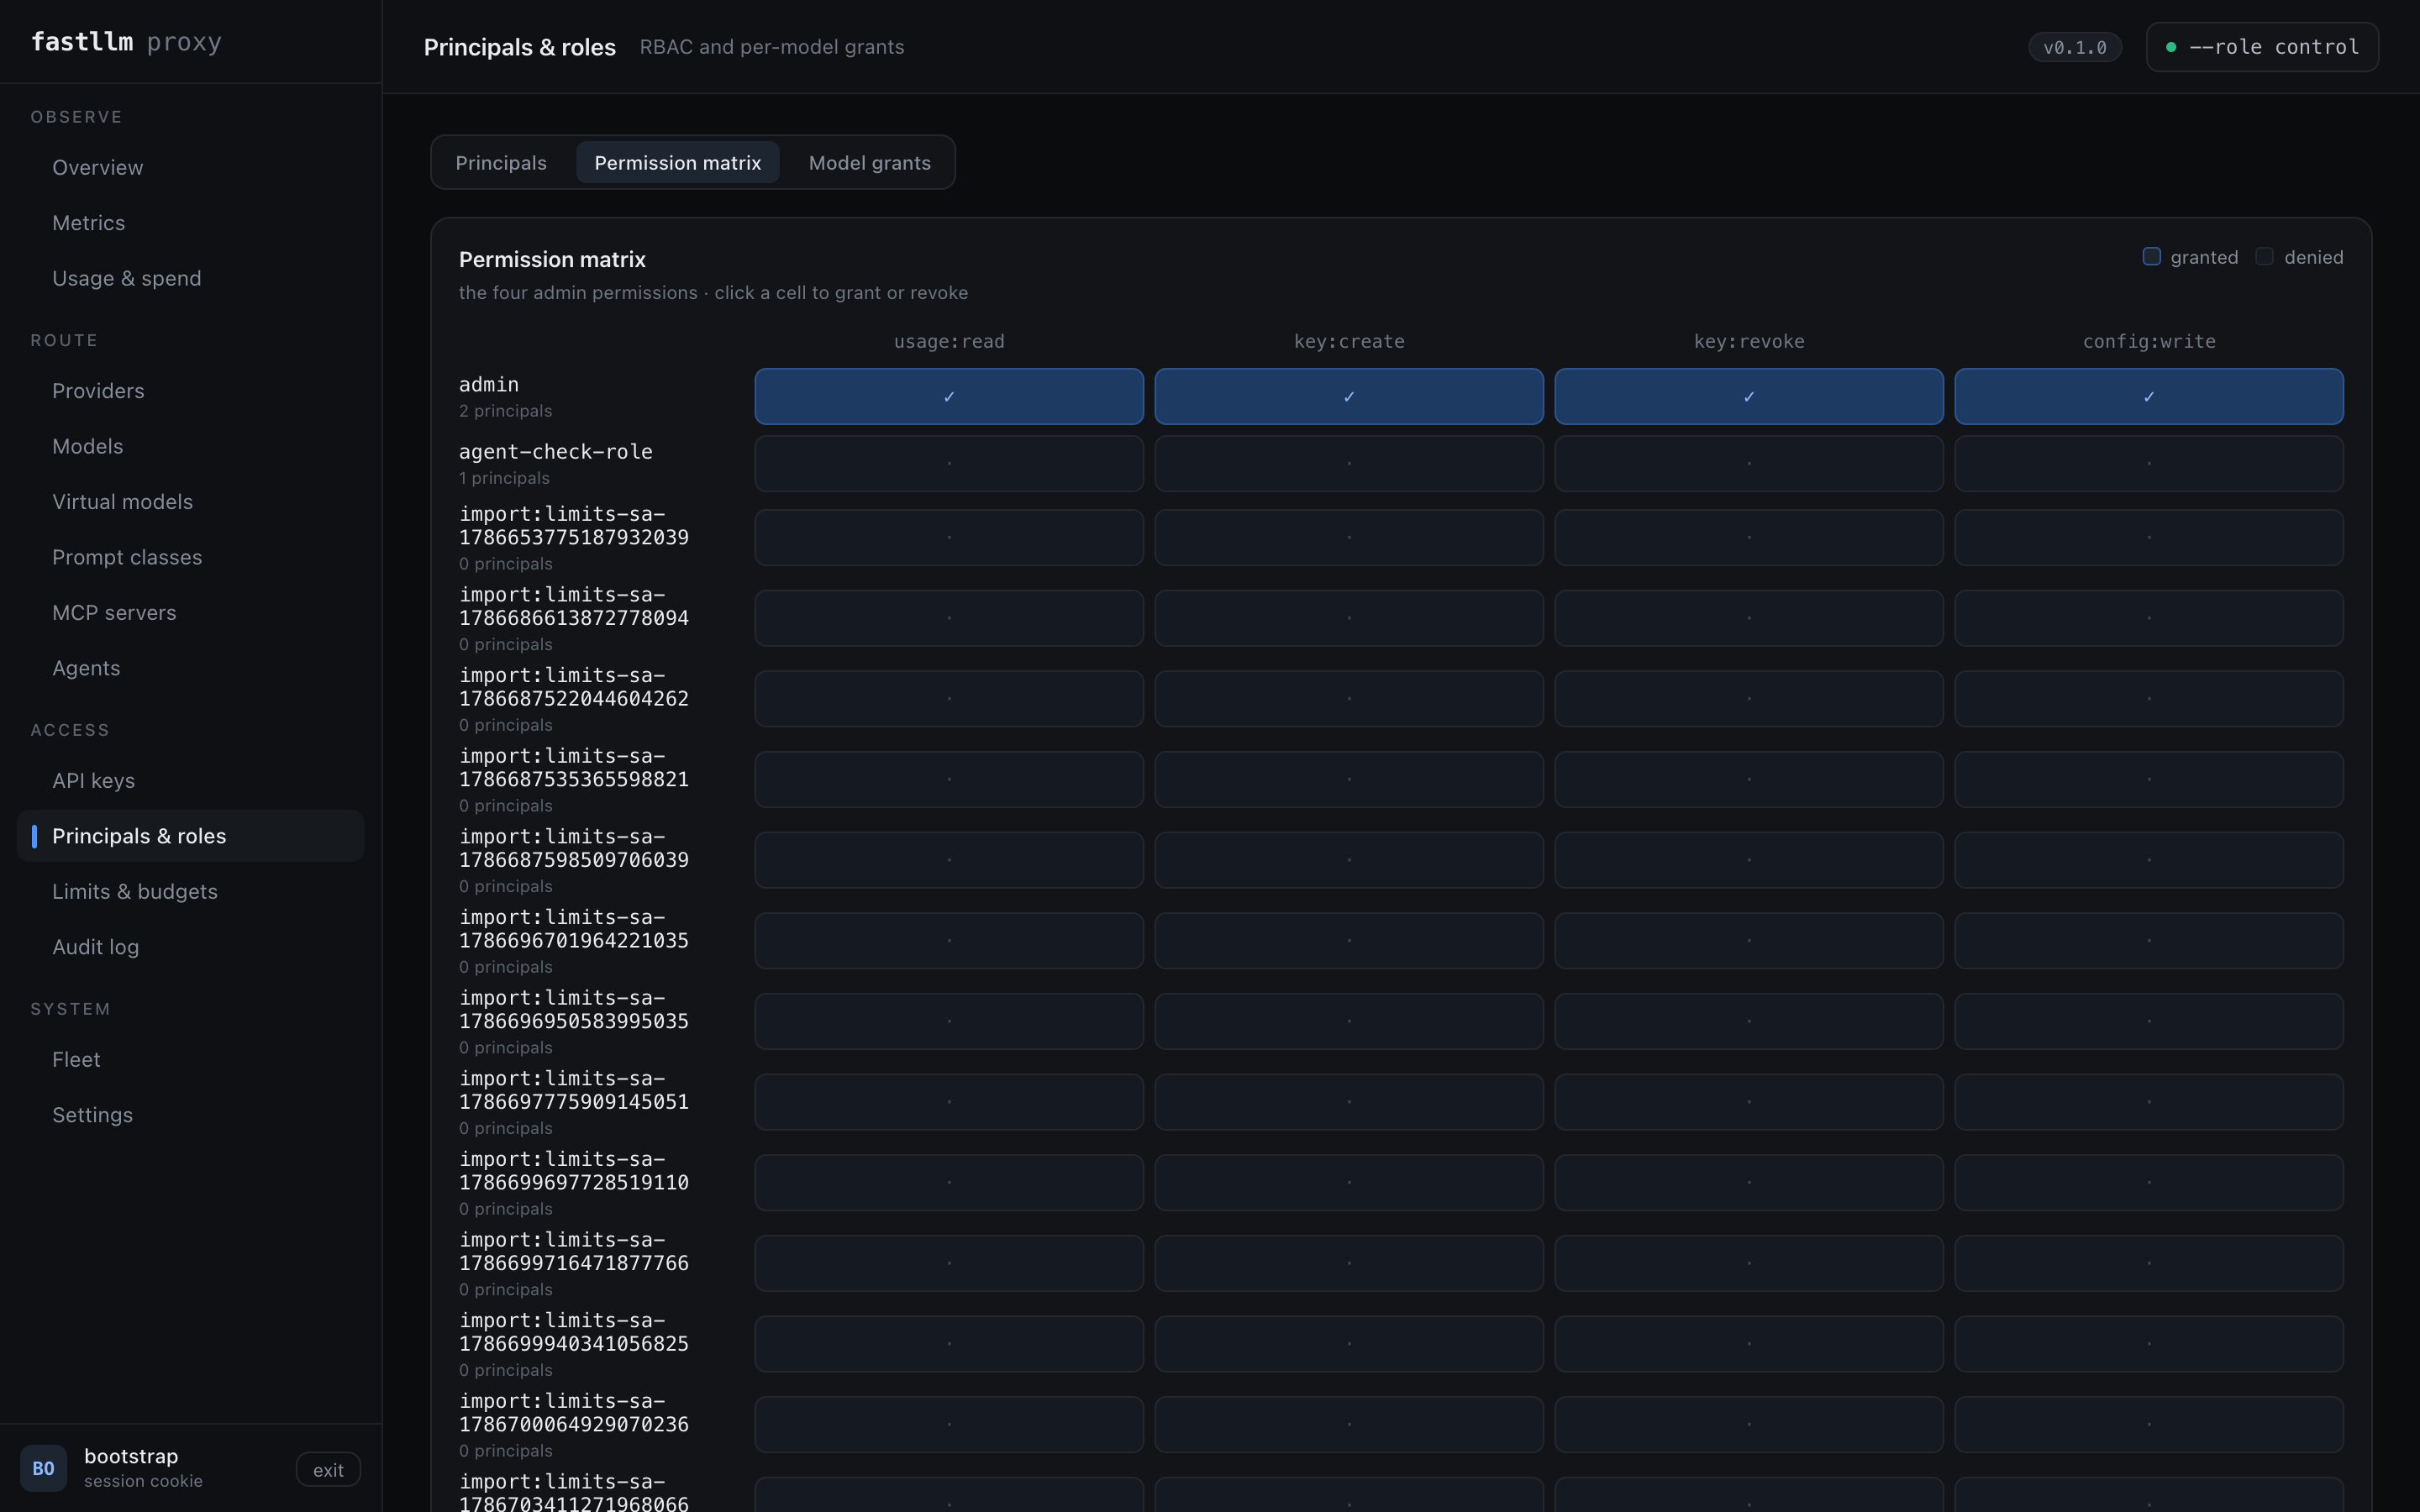
Roles carry permissions; principals hold roles. The matrix is the clearest
single picture of it — click a cell to grant or revoke. Model grants is the
same idea for model:invoke, per model.
A grant on a frontend model does cover the chain it routes to — the frontend model is the exposure, so granting it grants what the operator pointed it at. It is not a skeleton key: naming a provider model directly still needs a grant on that model.
This reversed a rule that required a grant on the resolved provider model. That
rule pinned every grant to a provider model's name, so renaming one revoked
access with nothing reporting it — see
.procoder/adr/0002-authorisation-moves-to-the-frontend-model.md.
Limits & budgets — caps that are enforced without a database call
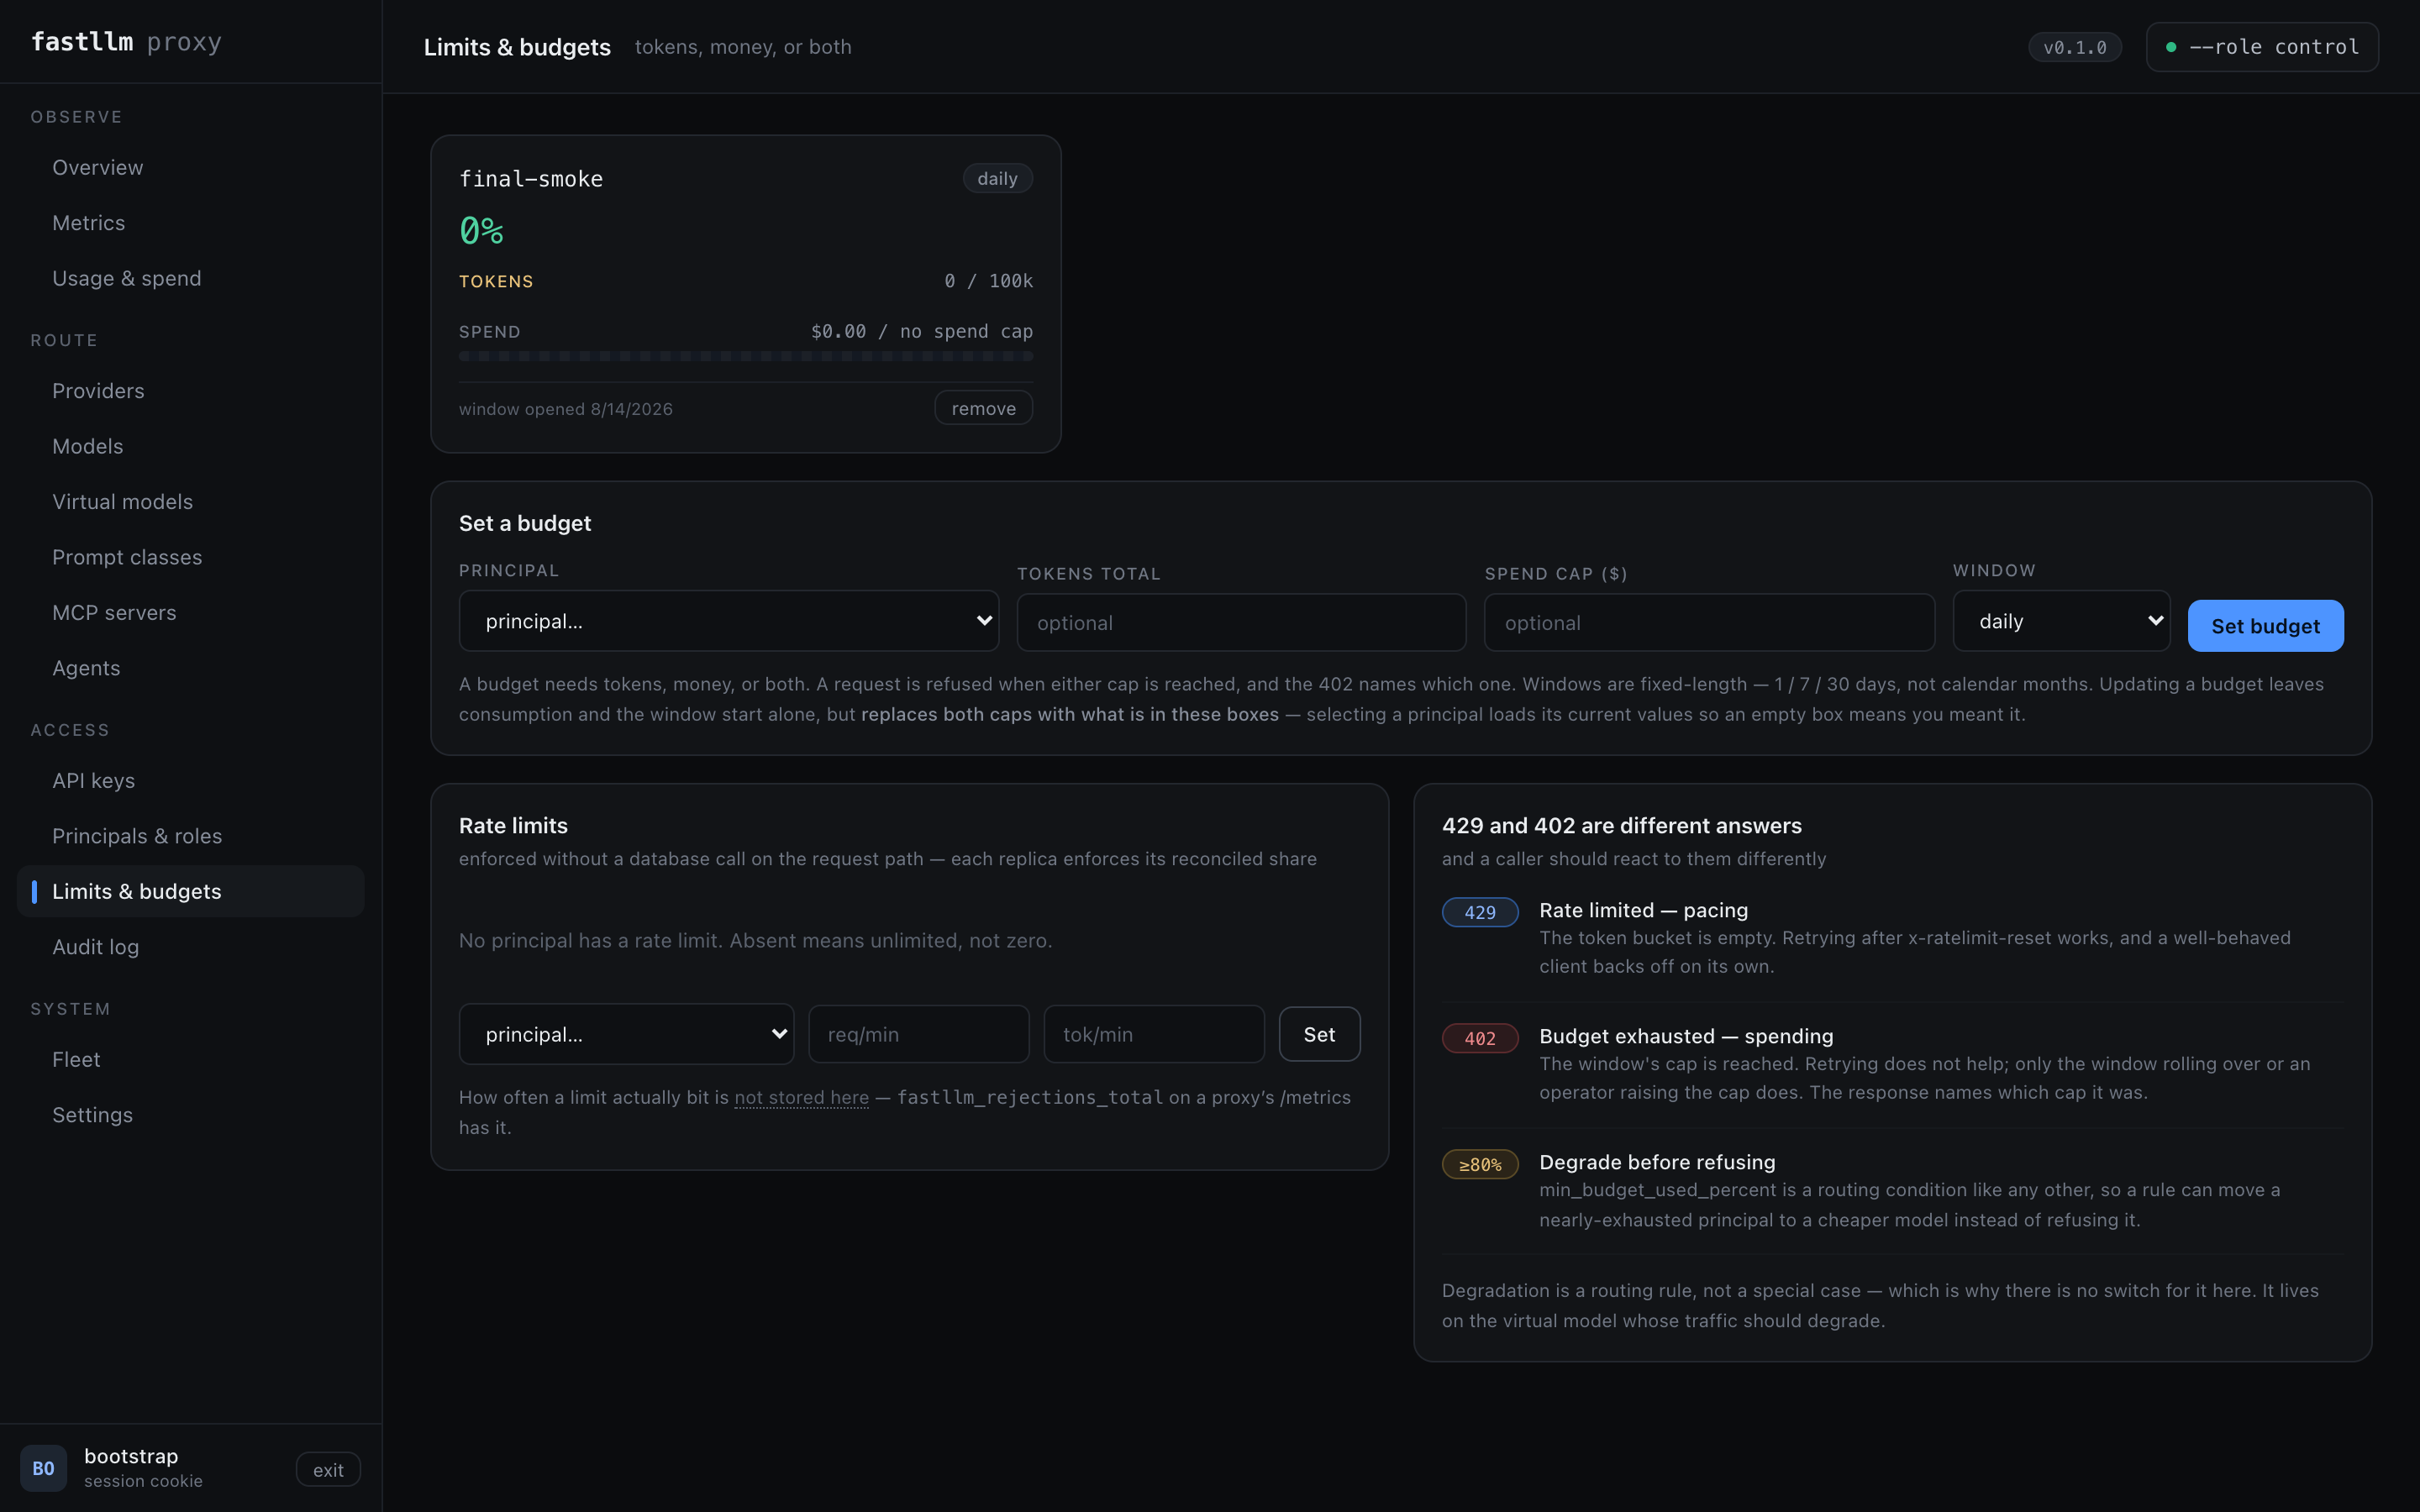
Rate limits are per minute, budgets are per window. Both are resolved into the snapshot, so enforcing them costs an integer comparison on the request path rather than a query. A request that pushes a principal over budget completes; the next one is refused with 402, not 429 — waiting does not help until the window rolls over.
Fleet — what each replica can see

Each backend row carries its prefix-cache hit rate, which is what makes
cache-affinity auditable. The policy routes by a hash of the prompt's first
bytes and assumes the chosen backend still holds that prefix; nothing used to
verify it, so a backend that restarted kept winning the same sessions while
re-prefilling every turn — the exact cost the policy exists to avoid. A dash
means unknown: no counters, no lookups yet, or restarted since the last
scrape. It is deliberately not 0%, which would read as affinity failing on a
backend nobody has used.
The screen opens with a topology: the management plane, the worker replicas, and the engine hosts, with each box carrying its own health and counters. It is there for the three things a table cannot show — that the control plane sits beside the request path rather than on it, that every worker reaches every backend rather than one each, and that an agent is why a host is listed at all. An endpoint no agent registered says "registered by hand" rather than borrowing one, and every arrow carries the interval it actually runs on, read from the deployment's own configuration.
The tables below it are the detail. Per replica, deliberately unmerged. A
replica on an older snapshot answers
/health with ok and misbehaves only on whatever changed — most often a key
it has never seen — so the snapshot version per replica is the thing to look at
when one replica behaves differently from the others.
The screen distinguishes a replica that is catching up from one that is stuck, and does it by the age of the newest snapshot rather than by the gap between version numbers — versions are stamped when the configuration last changed, so the gap measures the control plane's edit history, not any replica's health. Polling and reporting are on separate timers, so lagging briefly after a change is normal and shows as a quiet "still picking up the snapshot" note. The red banner needs either a snapshot that has been available for longer than those timers can explain, or a replica the screen has watched stay behind that long — the second being what catches a frozen replica on a gateway busy enough that the snapshot is never old.
Audit log — every change, and who made it
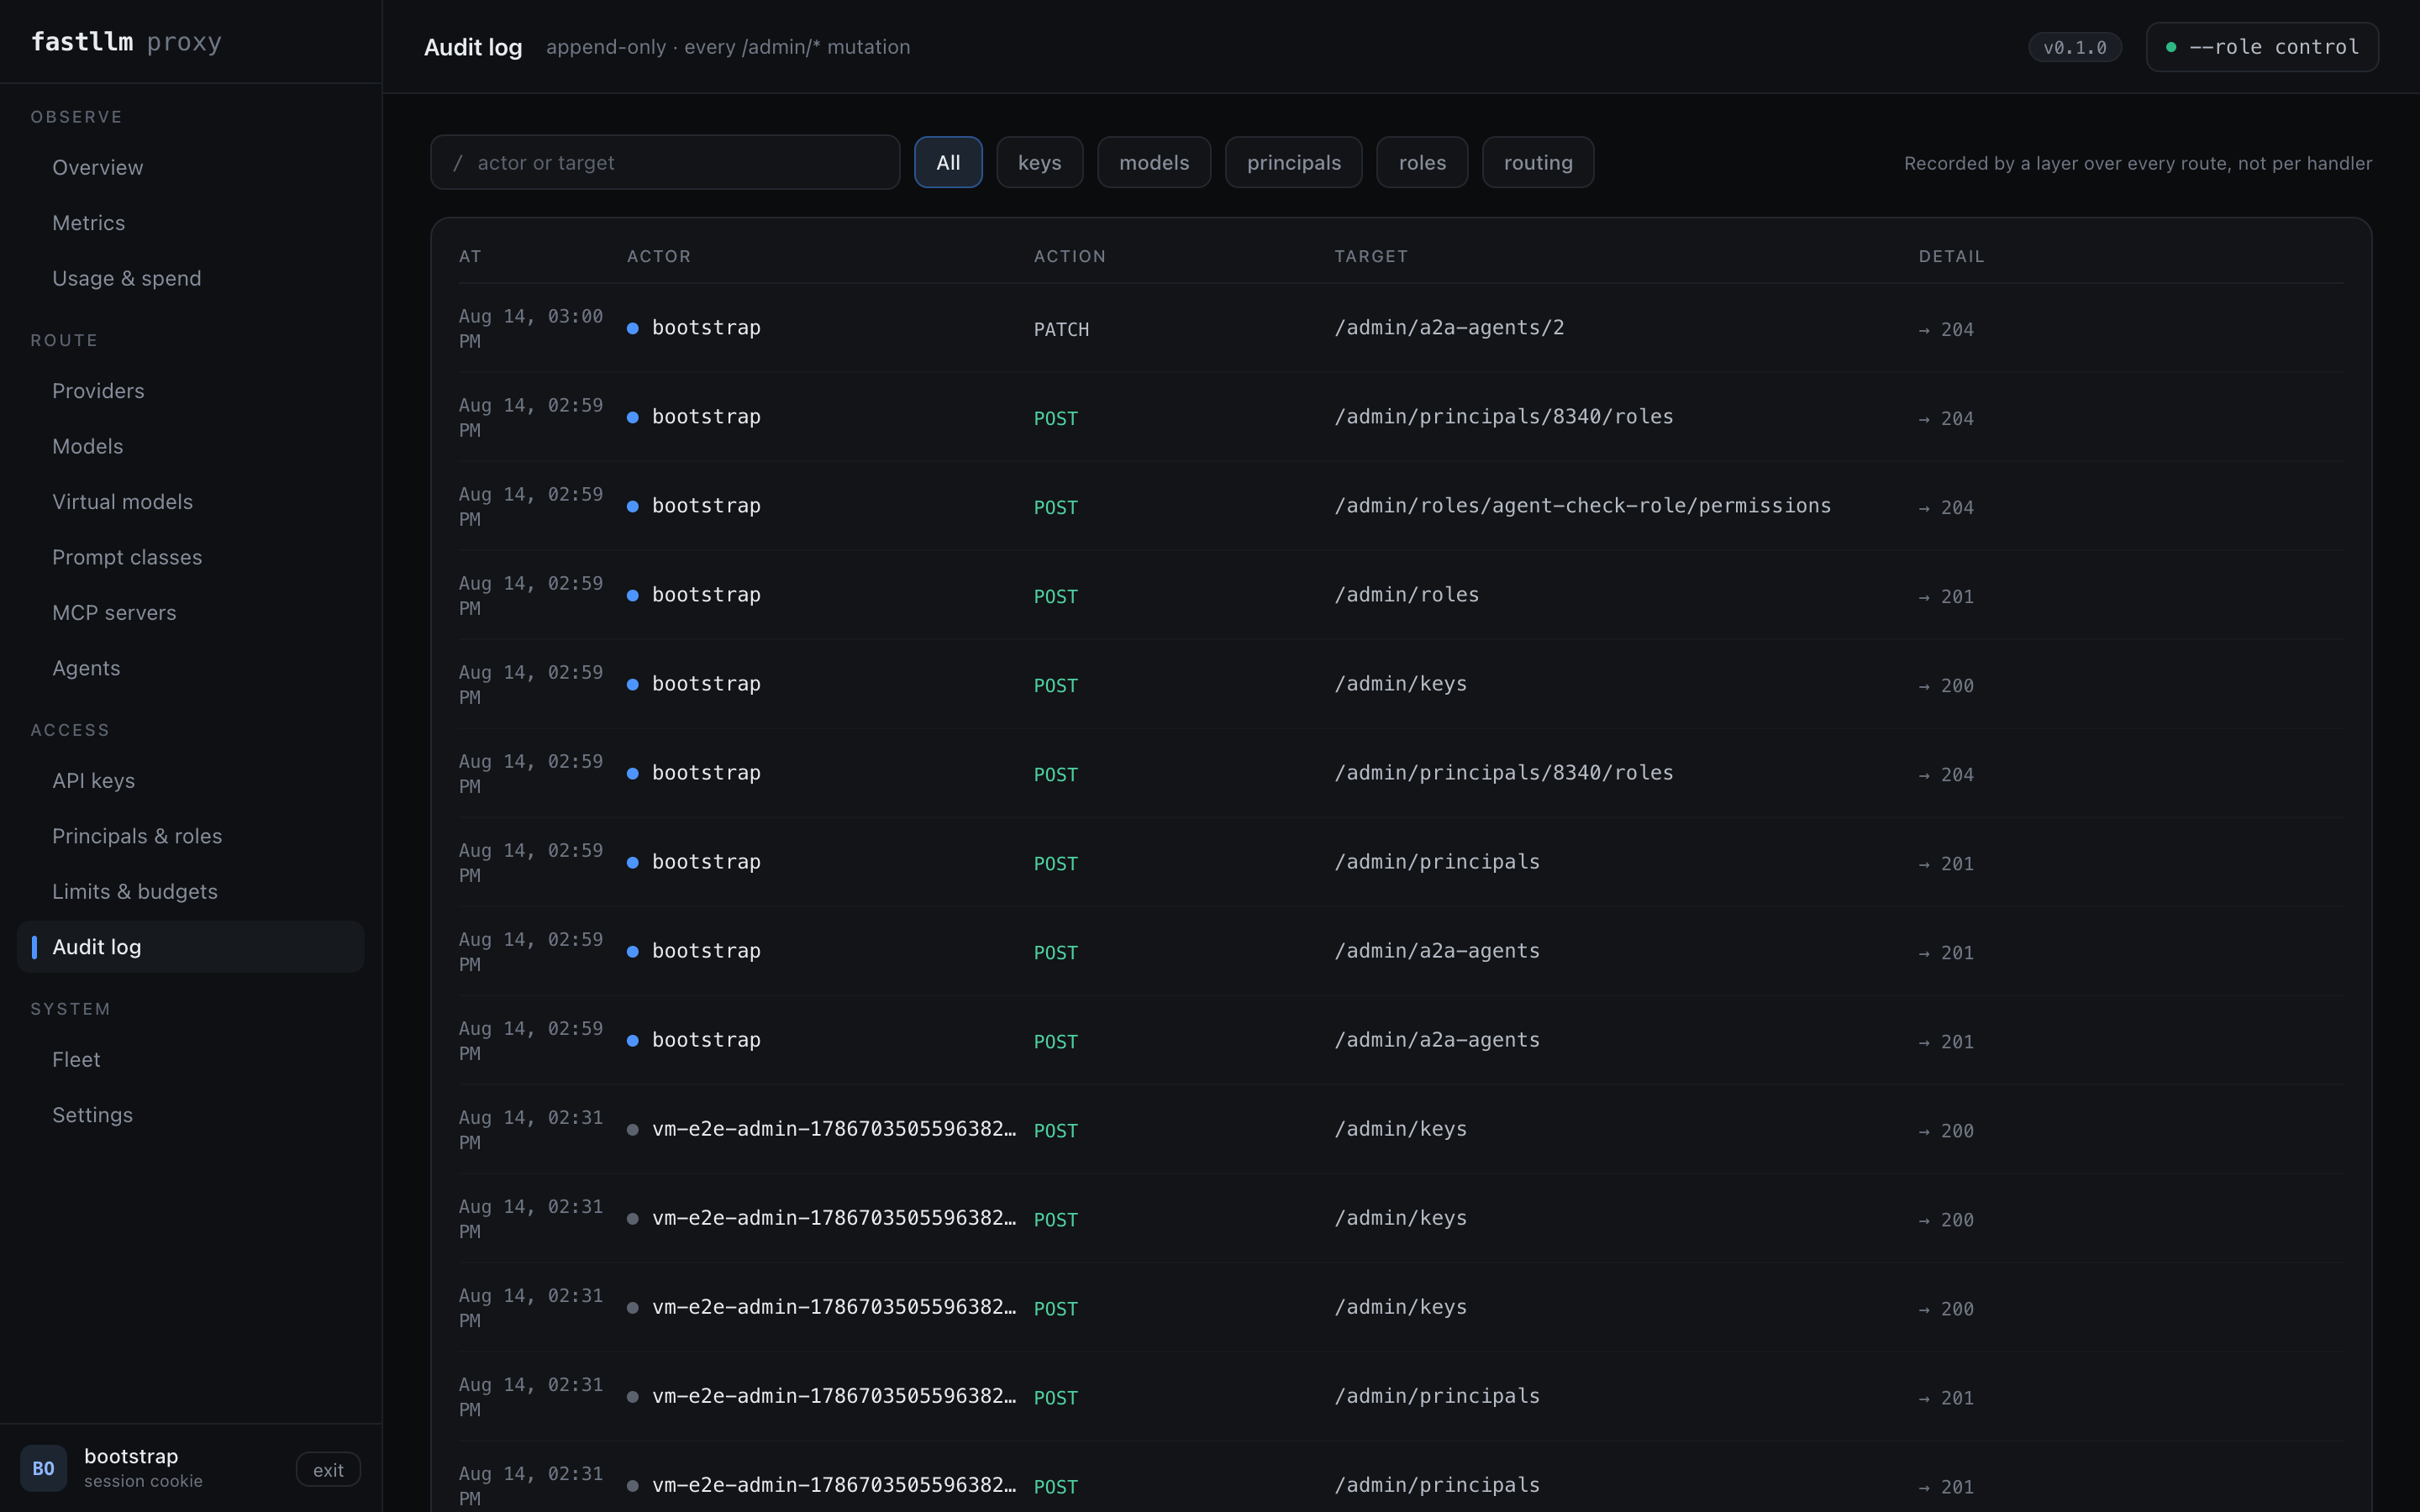
Append-only, newest first, filterable by actor or target. Reads are not recorded and neither are rejected attempts — it answers "what changed", not "who looked".
Settings — what this process was started with
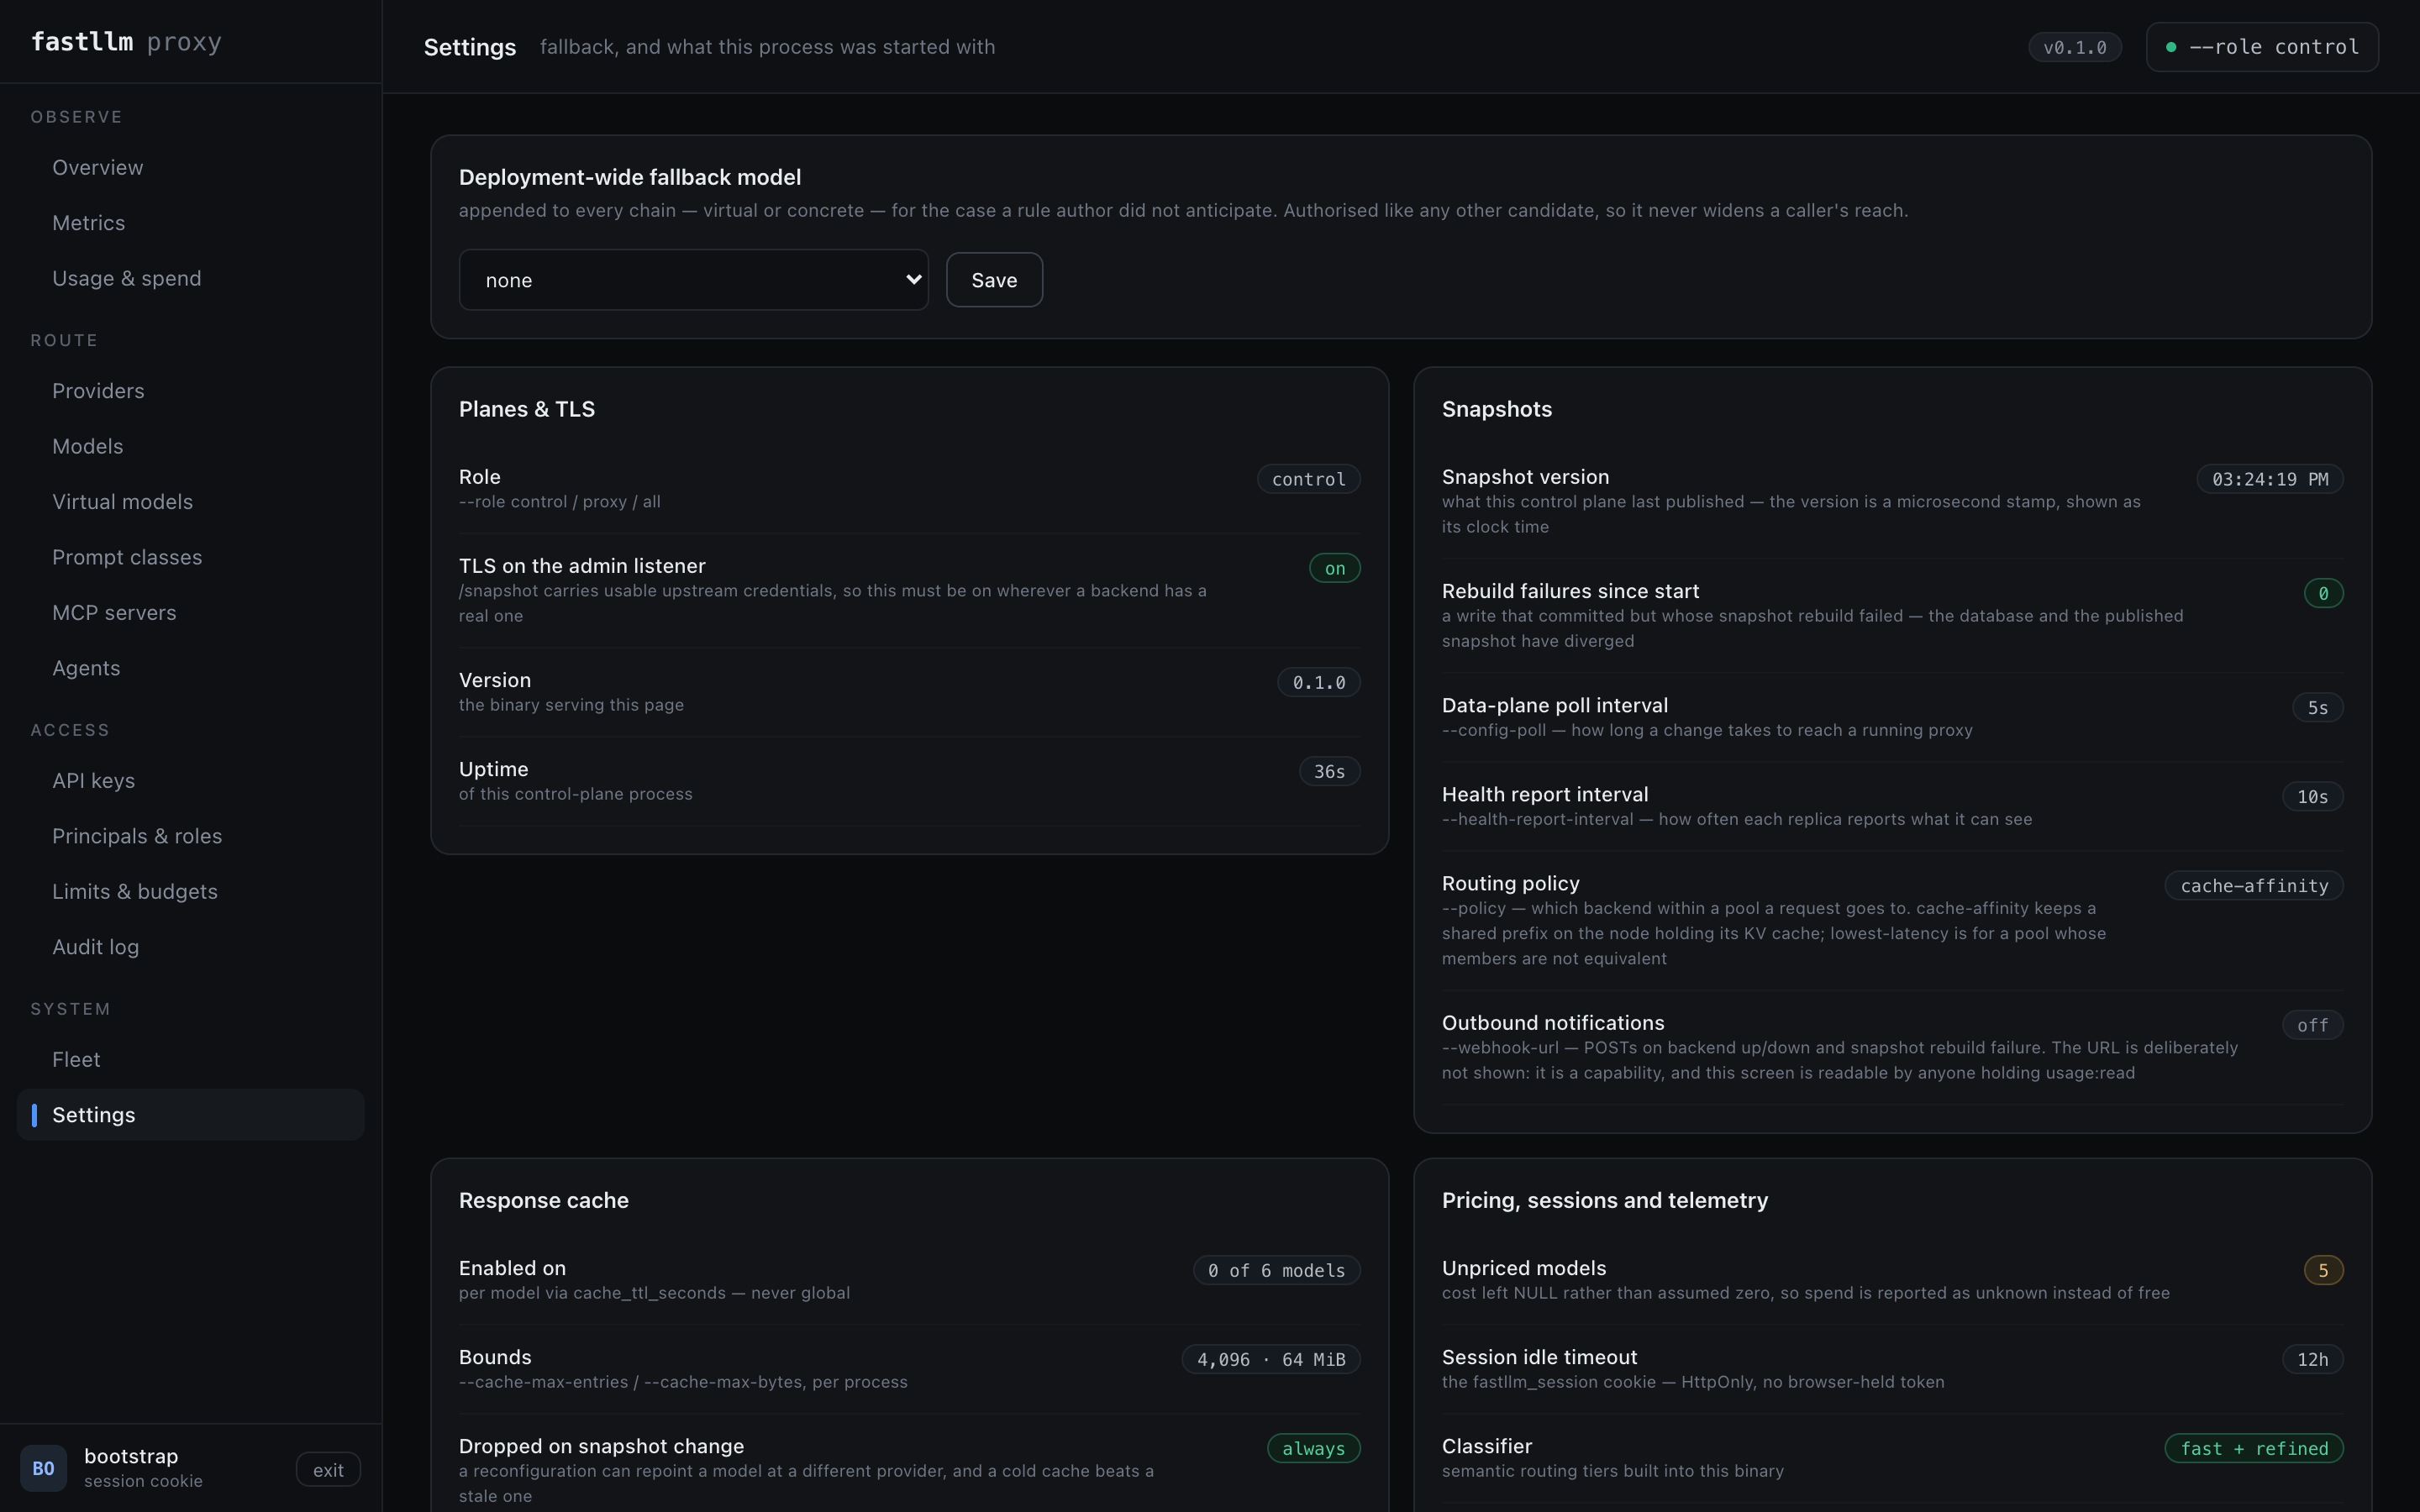
The flags this process is running with, the fallback model, and two actions worth being deliberate about: forcing a snapshot rebuild, and revoking every session including your own.
Where next
| Connecting a client | SDKs, coding agents, frameworks, observability |
| Troubleshooting | The failures people actually hit |
| Operations | The three roles, deployment shapes, configuration |
| API and administration | Every endpoint, and openapi.json |
Deployment
Only under the Kubernetes operator. Every other screen edits a row in
Postgres; this one edits the FastllmProxy resource that describes the
deployment itself — image, gateway replicas, selection policy, upstream
timeout, worker count, connection pool, and autoscaling — alongside the phase,
the conditions, the config hash and the image that is actually serving,
which during an ordered upgrade is not the one in the spec.
Applying a change patches the resource and hands it to the operator. The page says so: a rollout is not a snapshot, and reporting "saved" while two Deployments are still turning over would be a lie of tense.
Installs without an operator do not have this screen at all — not disabled, absent — and the routes behind it answer 404. See the operator.
Performance
Every number below was measured, on the hardware named, on the date named. Nothing here is projected or scaled from a smaller test. Where two runs of the same thing disagree, both are shown.
Against LiteLLM, in pictures
Measured 2026-08-07 on an arm64 Kubernetes cluster. Both gateways: one
replica, 4 CPU / 6 GiB, same idle node, reached over NodePort, same two vLLM
backends, interleaved A/B runs. LiteLLM ran 4 uvicorn workers in PRODUCTION
mode. Manifests: bench/compare/.
With the GPU removed — what the gateway itself costs
A mock upstream that answers instantly, so the gateway is the only thing being measured.


~15x the throughput and 10-28x lower latency, and the gap widens with concurrency rather than narrowing. This is the ceiling on what the choice can be worth, and you collect it only when the GPU is not your bottleneck — which is the next section, and the more honest one.
With real GPUs — throughput is a wash, consistency is not
Two vLLM replicas, 16 concurrent slots each. A gateway that balances correctly should climb to 32 concurrent streams and then flatten. Both do, and land on the same ceiling.


Aggregate throughput is a wash — both saturate the same GPUs, and at a single stream LiteLLM won several rounds outright. If your bottleneck is the GPU, the gateway barely moves your token rate.
What differs is steadiness. At 32 streams, p99 time-to-first-token is 766 ms against 2921 ms, and the gap between consecutive tokens is 15-25% less variable at every concurrency level:

A p50 that moves by 20 ms and one that moves by 280 ms are different products even when their medians match.
Against a real vLLM, the proxy is not measurable
Two runs against the live spark2 replica (arm64, qwen3-6-35b-a3b-nvfp4),
2026-08-06. "Direct" is the same client against the same vLLM with no proxy in
the path:
| through the proxy | direct | delta | |
|---|---|---|---|
| TTFT, run 1 | 83.2 ms | 83.8 ms | −0.6 ms |
| TTFT, run 2 | 90 ms | 93 ms | −3 ms |
| inter-token | 27.51 ms | 27.46 ms | +0.05 ms |
| 8 concurrent streams, aggregate | 121.8 tok/s | 118.7 tok/s | +3.1 tok/s |
| 8 concurrent, inter-token | 63.4 ms | 62.2 ms | +1.2 ms |
The proxy comes out marginally ahead on two of these, which is not a claim that a proxy makes inference faster — it is run-to-run noise on a live GPU, and that is the point: the overhead is below the noise floor of the thing it sits in front of.
Where the time actually goes
The proxy's own per-request work totals ~0.76 µs, against ~38 µs of core time per request. Roughly 2%; the rest is kernel, socket and HTTP protocol work that any process doing this job would pay.
| step | cost |
|---|---|
URL format + Uri parse | 156 ns |
BodyPeek parse (1 KiB body) | 229 ns |
| prefix hash for affinity | 108 ns |
| header copy | 97 ns |
| bearer header build | 92 ns |
| path allocations | 41 ns |
Authorisation, rate limiting and budget checks are not in that table because
they are set lookups against a pre-flattened in-memory snapshot — no database
call, no network call, no file read on the request path. tests/no_io_on_hot_path.rs
fails the build if that changes.
Synthetic ceilings
10-core arm64 macOS, --release, driven by a mock SSE upstream that flushes
every frame with no think time. That is the worst case for framing
overhead — a real vLLM emits one SSE event per HTTP frame tens of milliseconds
apart, so production numbers are better than these.
| measured | |
|---|---|
| streaming | 7,921 req/s, 471 MiB/s |
| non-streaming, 64 KiB bodies | 67,200 req/s |
| frame ceiling (any frame size) | ~650,000 frames/s |
| raw byte pump | ~3 GB/s |
What one architectural decision was worth
The upstream client used to be a pooled hyper_util client, which cost one
cross-task wakeup per frame. Replacing it with a connection this process owns
and drives from inside the response body (src/upstream.rs):
| before | after | |
|---|---|---|
| streaming | 1,314 req/s | 7,921 req/s |
| throughput | 78 MiB/s | 471 MiB/s |
| non-streaming | unchanged | unchanged |
A little over 6x, and it is why response bodies are never parsed: the win came from deleting a wakeup, not from batching. Coalescing already-arrived frames was measured at a merge ratio of exactly 1.000 in three separate settings — there is never a second frame waiting.
How much is left
A dumb bidirectional TCP relay — parsing nothing, framing nothing, the hard floor for any proxy — was measured on the same path:
| throughput | |
|---|---|
| direct hop, no proxy | 951 MiB/s |
| dumb TCP relay | 694 MiB/s |
| fastllm-proxy | 524 MiB/s |
So the entire remaining prize over a proxy that understands nothing is 1.32x, and only if detecting end-of-response were free — it is not, since the in-flight guard has to be released, the connection returned to the pool, and the next request served on the client socket, all of which need exactly the framing such a relay would skip. Paying for that with a hijacked client socket and no pooling is a bad trade.
Measured and rejected — do not retry without new evidence
Kept with their numbers so nobody re-litigates them from intuition. Nothing is currently identified as worth doing.
- Coalescing already-arrived frames. Merge ratio measured at exactly 1.000 in three separate settings: against the pooled client, against the owned connection that replaced it, and against a real vLLM. There is never a second frame waiting. It was the deleted wakeup, not batching, that gave the 6x.
- A hand-rolled
modelscanner to skip the JSON parse. 67.1k → 67.2k req/s on 64 KiB bodies.serde_jsonskips what it does not want at ~16 B/ns and the parse is ~3% of a request; a bespoke parser on the routing path is not worth the risk of misrouting. - Pre-parsed
Uriper backend per endpoint. ~0.2%, and it forces an endpoint-index coupling betweenproxy.rsandregistry.rs. - Anything else on the request path. There is under 1µs available in total.
rewrite_model_if_neededis not a JSON round trip in the common case. Raised again in review as "a full re-serialize on every rewrite"; it returns the body unchanged when the names match, and splices the bytes in place when themodelfield's range is known. Theserde_json::Valuepath is the fallback for a body neither applies to.
Usage extraction was the most expensive thing on the response path
Found while benchmarking telemetry, and unrelated to it. TailBuffer::extract_usage
runs once per request for any principal with a budget or a token rate limit. It
parsed every data: line in the 8 KiB tail into a full serde_json::Value
— around sixty allocated trees — to find the usage chunk, which sits at the
very end.
| before | after | |
|---|---|---|
| usage present | 22.0 µs | 0.6 µs |
| no usage in the tail | 32.4 µs | 2.8 µs |
Against roughly 38 µs of core time per request, the old figures were most of a
request again. Two changes: search backwards and stop at the first hit, since
"the last matching line wins" is the same answer as "the first match from the
end"; and scan for a single byte before comparing, which the compiler
vectorises, rather than windows(n) comparing at every offset.
What telemetry costs
Measured on this machine with bench/micro, because "no performance impact" is
a claim and claims here need numbers.
| instrument | cost |
|---|---|
Instant::now() | 14 ns |
Instant::elapsed() to microseconds | 19 ns |
AtomicU64 increment, uncontended | 2 ns |
Histogram::record_us, uncontended | 2 ns |
Histogram::record_us, 2 threads | 29 ns |
Histogram::record_us, 8 threads | 57 ns |
A request pays one clock read on arrival, one per-model lookup, and on completion one elapsed plus two histogram records and a couple of counter increments — roughly 80-150 ns depending on contention, against ~38 µs of core time per request. Under half a percent, and the per-request fixed work in the table above is unchanged.
Two design choices carry most of that. The histogram has no count field —
the total is the sum of its buckets, added up at scrape time — because a
third atomic on a single cache line cost more than it sounds: 91 ns per record
at 8 threads with it, 57 ns without. And nothing formats a string while
serving; labels are resolved when the snapshot is built, and the only
allocation is on /metrics, at scrape time.
Classifier tiers
Semantic routing costs what it measures. Same machine, --release — see
what the classifier costs for the data and the
method:
| tier | model | p50 per prompt | what it separates |
|---|---|---|---|
| 1 | potion-base-8M | 103 µs | subject-matter classes |
| 1 | potion-code-16M | 115 µs | best on coding (98.7%) |
| 1 | potion-retrieval-32M | 137 µs | best all-round (90.0%) |
| 2 | all-MiniLM-L6-v2 | 1.66 ms | modest gain over tier 1 |
| 2 | bge-small-en-v1.5 | 3.27 ms | same-subject/different-intent |
Tier 1 is a token-vector lookup and a mean — no transformer, no matmul. Cost also plateaus rather than growing with the prompt, because the encoder stops at its token cap: a 64 KB paste costs exactly what a 4 KB one does.
Measured accuracy, held out over ~21k human-labelled prompts
(HuggingFaceH4/no_robots, openai/gsm8k, eleven StackExchange communities):
| class | tier 1 precision | recall |
|---|---|---|
| coding | 97.6% | 92.6% |
| chat | 95.8% | 98.0% |
| generation | 96.8% | 69.6% |
| math | 88.0% | 97.6% |
| devops | 86.8% | 90.5% |
| finance | 86.2% | 91.6% |
| legal | 85.9% | 75.0% |
| security | 84.8% | 82.3% |
| factual-qa | 83.7% | 50.4% |
| databases | 82.3% | 91.1% |
Tier 2 is consulted only when a routing rule names a class that needs it. If no rule does, the transformer is never loaded and no request can pay for it. On realistic traffic mixes escalation touches under a tenth of requests, which puts the average added cost near 0.2 ms.
Two findings worth knowing before configuring classes:
- Classify by subject, not by verb. Subject-matter classes (legal, finance, security, coding) reach 82-98% precision on tier 1. Task-shaped classes (summarise, rewrite, extract) fail on both tiers — under bge-small, Summarize scores 46.6% and Extract 35.6%, worse than tier 1. Telling "summarise this" from "extract the dates" needs instruction understanding, not better embeddings.
- Margins are not comparable across models. bge-small reports higher raw cosine similarities than the static model while classifying better, because its space is anisotropic. Confidence floors are calibrated per class and per tier.
Against LiteLLM
Measured 2026-08-07 on the kw cluster. Both gateways: one replica, 4 CPU /
6 GiB limits, pinned to the same otherwise-idle 8-core arm64 node, reached over
NodePort (not a kube-vip LoadBalancer VIP, so the VIP's L2 path is not in the
measurement). Same two vLLM backends, same model, same prompts, same load
generator on the same LAN. LiteLLM runs 4 uvicorn workers in PRODUCTION mode
with callbacks and caching off — anything that would slow it down without being
intrinsic to it is turned off, because a comparison that misconfigures the
other side proves nothing. Manifests are in bench/compare/.
With a real GPU in the path, 7-8 interleaved A/B pairs per concurrency
level. Ratios are computed within each pair, because absolute throughput on a
shared GPU drifts between sessions and only the paired comparison cancels it.
Backend attribution was verified from each vLLM replica's
vllm:request_success_total: both gateways spread across both replicas
(fastllm-proxy 13/14, LiteLLM 15/11 over one run), so neither was accidentally
running against half the hardware.
| fastllm-proxy | LiteLLM | median ratio | |
|---|---|---|---|
| TTFT p50, 4 streams | 161 ms (134-277) | 189 ms (160-544) | 1.28x |
| TTFT p50, 8 streams | 173 ms (165-184) | 201 ms (186-469) | 1.14x |
| throughput, 4 streams | 74 tok/s | 69 tok/s | 1.09x |
| throughput, 8 streams | 133 tok/s | 122 tok/s | 1.03x |
Throughput is close to a wash. At 8 concurrent streams the median advantage is 3%, which is inside the run-to-run noise of a shared GPU. At concurrency 1 (not tabled) it is a tie, and LiteLLM won some rounds. If your bottleneck is the GPU, the gateway barely moves your token rate — that is the honest headline for a single-GPU deployment.
Latency and its consistency are where the difference is real. Median TTFT is 14-28% lower, and the spread matters more than the median: across eight rounds at 8 concurrent streams, fastllm-proxy's TTFT stayed within 165-184 ms while LiteLLM's ranged 186-469 ms. A p50 that moves by 20 ms and a p50 that moves by 280 ms are different products even when their medians are close.
With the GPU removed from the path — a mock upstream that answers instantly, so the gateway is the only thing left to measure:
| concurrency | TTFT p50, fastllm-proxy | TTFT p50, LiteLLM | ratio |
|---|---|---|---|
| 1 | 9.7 ms | 70.4 ms | 7.3x |
| 8 | 14.3 ms | 224.8 ms | 15.7x |
| 32 | 37.4 ms | 705.5 ms | 18.9x |
This is what the gateway itself costs, and it is where the architecture shows: the gap widens with concurrency rather than narrowing. It also sets the ceiling on what the choice can ever be worth to you — you only get it back when the GPU is not the bottleneck, which means many backends, short generations, or high concurrency.
Two caveats, both against our own favour:
- The mock throughput numbers are not usable and are not quoted. Under the mock's instant-burst framing LiteLLM delivered 101 SSE events and 600 characters where fastllm-proxy delivered 199 and 1194 — roughly half the payload. Against the real vLLM both delivered 38 events and matching content, so this is an artefact of the mock's pacing rather than something LiteLLM does in production. Only TTFT is quoted from that run, and only as indicative.
- kube-proxy and two LAN hops are inside both sets of numbers. They inflate both sides equally, which compresses the ratios — so the pure gateway difference is larger than what is reported here, not smaller.
What has not been measured
LiteLLM is the only other gateway measured; Envoy, Kong, Portkey and the rest are not. And every number here comes from one cluster, on arm64, on one day. Re-measure on your own hardware before betting on any of it.
Reproduce any of this with cargo run -p bench --release --bin realbench
(and siblings) — see bench/.
Usage accounting on every request
Measured on a kw worker node (worker-25, aarch64, 8 cores), release
build, cargo run -p bench --release --bin tailparse.
Usage recording used to be limited to principals with a budget or a tokens-per-minute limit, so this cost fell on a minority of traffic. It is now paid on every request that has a principal, which makes it a per-request cost this file owes a number for.
| what | per request | when |
|---|---|---|
TailBuffer::push, one SSE frame | 68 ns | per frame forwarded |
TailBuffer::push, a 60-frame stream | 661 ns | whole stream |
extract_usage, small non-streaming body | 2.55 µs | once, at end |
extract_usage, SSE tail (60 frames) | 1.33 µs | once, at end |
extract_usage, 22 KB body (tail is a fragment) | 8.40 µs | once, at end |
extract_usage, tail carrying no usage | 0.21 µs | once, at end |
Against a request whose core proxy cost is ~38 µs (bench/micro), the
common cases add roughly 3–7%. The expensive row is the one the tail-buffer
fix added: a body far larger than the 8 KiB window, where the tail is a
fragment and the backwards scan walks it before finding the usage key. It
is paid by embeddings and by long non-streaming completions, and it buys
token counts that were previously dropped on the floor — 8 µs against a
request that took 22 ms upstream.
None of this is I/O. record is a non-blocking try_send into a bounded
queue drained by a background flush, so tests/no_io_on_hot_path.rs still
holds. The measurement is here because "one small parse per request" was an
adjective until it had a number.
Not tried, and why: moving the parse off the request thread entirely. It would trade 1–8 µs of latency for a second copy of the tail per request, which is the wrong side of the trade at these magnitudes — and the parse is already the last thing that happens on a body that has finished streaming, so the client is not waiting on it.
What it can do
The lowest-overhead router in front of everything you serve: chat, images, speech, embeddings and reranking through one endpoint, with routing that keeps your KV cache warm and accounting that costs the request path nothing.
What follows is what it does and what that is worth measured — including the places the measurements are less flattering, because you cannot plan a deployment from numbers that only ever point one way.
Where the low overhead comes from
Three properties, and each is structural rather than a setting you tune.
No I/O on the request path. RBAC, per-model grants, rate limits and
budgets resolve to integer comparisons against a snapshot already flattened in
memory. tests/no_io_on_hot_path.rs fails the build if anything I/O-shaped
lands there, which is what keeps it true after the fact.
No parsing on the response path. An openai-protocol body is forwarded
byte-for-byte in both directions — never deserialised, never re-encoded, never
buffered. A gateway that decodes each SSE chunk to re-emit it pays thousands
of parse cycles per second per stream, and that cost scales with how much your
users read. This one pays none of it.
Routing that knows what your engine knows. vLLM and SGLang keep a radix/prefix KV cache, so two requests sharing a system prompt are far cheaper on the same node — the second reuses the first's cached prefix instead of prefilling it again. Cache-affinity routing sends them there, unless that node is meaningfully hotter than the least-loaded one. Round-robin alternates them by construction, so every request pays full prefill: nodes look evenly loaded while aggregate throughput falls, and a second node can leave you worse off than one.
What that is worth, measured
Against LiteLLM, same cluster, same backends, interleaved A/B runs (full conditions):
| fastllm-proxy | LiteLLM | |
|---|---|---|
| Throughput, mock upstream | ~500–635 req/s | ~36 req/s |
| TTFT, mock upstream | 8–46 ms | 87–1313 ms |
| Aggregate tok/s, real GPUs | 305–332 | 305–332 |
| p99 TTFT at 32 streams | 766 ms | 2921 ms |
| Inter-token jitter | 15–25% lower | — |
Read the third row before the first two. With real GPUs, aggregate throughput is a wash — both saturate the same hardware, and at a single stream LiteLLM won several rounds outright. The 15× figure is what the gateway costs when the GPU is not your bottleneck, which is a ceiling on the value, not a promise of it.
What survives contact with real GPUs is steadiness: p99 time-to-first-token and inter-token jitter. A p50 that moves by 20 ms and one that moves by 280 ms are different products even when their medians match.
Against a real vLLM the proxy's own overhead is below the noise floor — 0.76 µs of per-request work against ~38 µs of core cost, and two runs put it marginally ahead of no-proxy, which is measurement noise and reported as such.
The features, and why each exists
Routing that knows about prefixes
Cache-affinity with a load escape hatch: a shared prefix returns to the node
holding its KV cache, unless that node is meaningfully hotter than the
least-loaded one. The policy is per provider model: two identical local
replicas sharing a prefix cache want affinity, three hosted providers of
differing speed want lowest-latency, and one deployment commonly has both —
so --policy is the default and each provider model may override it
(Provider models screen, or policy on the admin API). least-loaded, round-robin
and lowest-latency are
selectable — the last for pools whose members are not equivalent, where a slow
backend with one queued request looks emptier than a fast one with two.
How a request finds a backend
flowchart TD
    R["request<br/>model: 'assistant'"] --> V{"a frontend model?"}
    V -->|no| POOL
    V -->|yes| RULES["rules, in order<br/>first match wins"]
    RULES --> CND["conditions: principal · role · prompt size<br/>streaming · headers · budget · time of day<br/>semantic class"]
    CND --> T["targets — weighted <i>and</i> ordered<br/>a split and a failover chain at once"]
    T --> GRANT{"caller has<br/>model:invoke?"}
    GRANT -->|no| DROP["dropped from the chain<br/>failover never widens reach"]
    GRANT -->|yes| POOL["the provider model's pool"]
    POOL --> POL{"policy"}
    POL -->|cache-affinity| AFF["prefix hash → the node<br/>holding that KV cache<br/><i>unless it is meaningfully hotter</i>"]
    POL -->|least-loaded| LL["fewest in-flight"]
    POL -->|lowest-latency| LAT["lowest EWMA latency"]
    AFF --> B([backend])
    LL --> B
    LAT --> B
Every decision in that diagram is answered from the pre-flattened snapshot in memory. None of it is a query — which is the reason the whole thing is affordable per request.
Frontend models: routing as configuration, not code
One client-facing name, ordered rules, weighted and ordered targets — so a rule is both a traffic split and a failover chain. Rules match on principal, role, prompt size, requested generation, streaming, headers, budget consumption, in-flight count, time of day, or the prompt's semantic class.
Failover never widens reach: a candidate the caller lacks model:invoke on is
dropped from the chain, including the deployment-wide fallback.
Semantic routing, at a cost you can afford
A ~115 µs static-embedding tier decides most prompts; an int8 ONNX transformer loads only if a rule names a refined class. Classify by subject, not by verb — the measurements behind that are in the classifier doc, including which class pairs collide.
RBAC that is not a shared secret
Principals, roles, per-model model:invoke grants. Keys are SHA-256 hashed;
passwords are Argon2id — deliberately different, because keys are
high-entropy random and passwords are low-entropy and human-chosen.
Accounting that is enforced without I/O
Rate limits, token budgets and spend, resolved into the snapshot so the request path does an integer comparison rather than a query. Usage is recorded for every attributable request, priced at the price in force when the request ran, and stored in integer micro-units.
A control plane you can split from the data plane
One binary, three shapes via --role. The same image is a single container in
a lab and a scaled deployment in Kubernetes. A proxy that loses its control
plane keeps serving from its last-known-good snapshot rather than failing.
80 providers, and adding one is a row in a table
Anything OpenAI-shaped works whether or not it is on the list. Anthropic and Gemini are reached in their own wire format, translated in both directions including streaming and tool calls.
Tools, not just models
An MCP gateway on the same endpoint and the same keys: a tool server is a row,
its tools arrive namespaced <server>__<tool> so two servers can both expose
search, and access is mcp:invoke on mcp/<name> — deliberately not
implied by model:invoke, because tools have side effects and models do not.
A caller lists every tool it may reach in one call and hands the result
straight to any OpenAI-compatible model. One server being down names itself in
unreachable rather than failing the list.
And the same for A2A agents: one address, cards rewritten so the client's
next call is still authorised and attributed, protocol versions pinned rather
than guessed, and agent:invoke implied by neither of the other two.
Beyond chat: what else it serves
Twelve POST endpoints, not one. Anything OpenAI-shaped that carries a
model is forwarded byte-for-byte, authorised by the same per-model grants
and counted in the same usage accounting:
| Chat & completions | /chat/completions, /completions, /responses |
| Images | /images/generations, /images/edits |
| Speech | /audio/speech (TTS), /audio/transcriptions, /audio/translations |
| Embeddings & ranking | /embeddings, /rerank, /score |
| Safety | /moderations |
So an image or speech provider is the same one-row configuration as a chat model — OpenAI, Azure OpenAI, or any self-hosted server exposing those paths. The multipart audio uploads are forwarded without the boundary being touched, and binary responses pass through the same byte pump as a token stream.
One thing this does not do is translate a provider's bespoke, non-OpenAI image API into OpenAI's shape. A provider that speaks its own wire format for images needs a translator, the same way Anthropic and Gemini needed one for chat.
On the roadmap
Named because they are wanted, not because they are excuses. Each is a real piece of work rather than a flag away:
| Guardrails and PII masking | Content filtering and redaction in the gateway. Needs a hook point on the request path that does not cost the latency the rest of the design protects — the interesting engineering is doing it without buffering the body |
| SSO / SAML | Sessions are Argon2id passwords today. The RBAC underneath — principals, roles, per-model grants — is already the right shape to hang an identity provider off |
| Teams and organisations | A layer above principals, so a grant can be made once for a group |
| Native image and speech providers | The wire-format translators for providers that do not speak OpenAI's shape |
| Usage-based routing | Route by a deployment's remaining TPM/RPM. Wanted, but honest cross-replica accounting needs shared state, which is the trade being weighed |
Where it is a poorer fit
Two, and both are about your situation rather than a missing feature:
Your bottleneck is the GPU and your current gateway works. The honest reading of the benchmarks above is that you would gain steadier tails and lose a working integration. Steadier p99 is worth real money to some deployments and nothing to others; only you can price it.
You want one integration point for every AI service you use. This is a gateway for models you serve and models you buy through an OpenAI-shaped API. If you also need vector stores, agent frameworks and observability vendors behind the same endpoint, a broader tool fits better.
Where next
| Getting started | Install, first request, and a tour of the UI |
| Performance | Every number, its conditions, and what was not measured |
| Architecture | How the pieces fit and how they fail |
Providers
Adding a provider is a row in a table — not a code change, not a release. Anything speaking the OpenAI API is already supported whether or not it is on the list below; the list exists so you do not have to go and find the base URL.
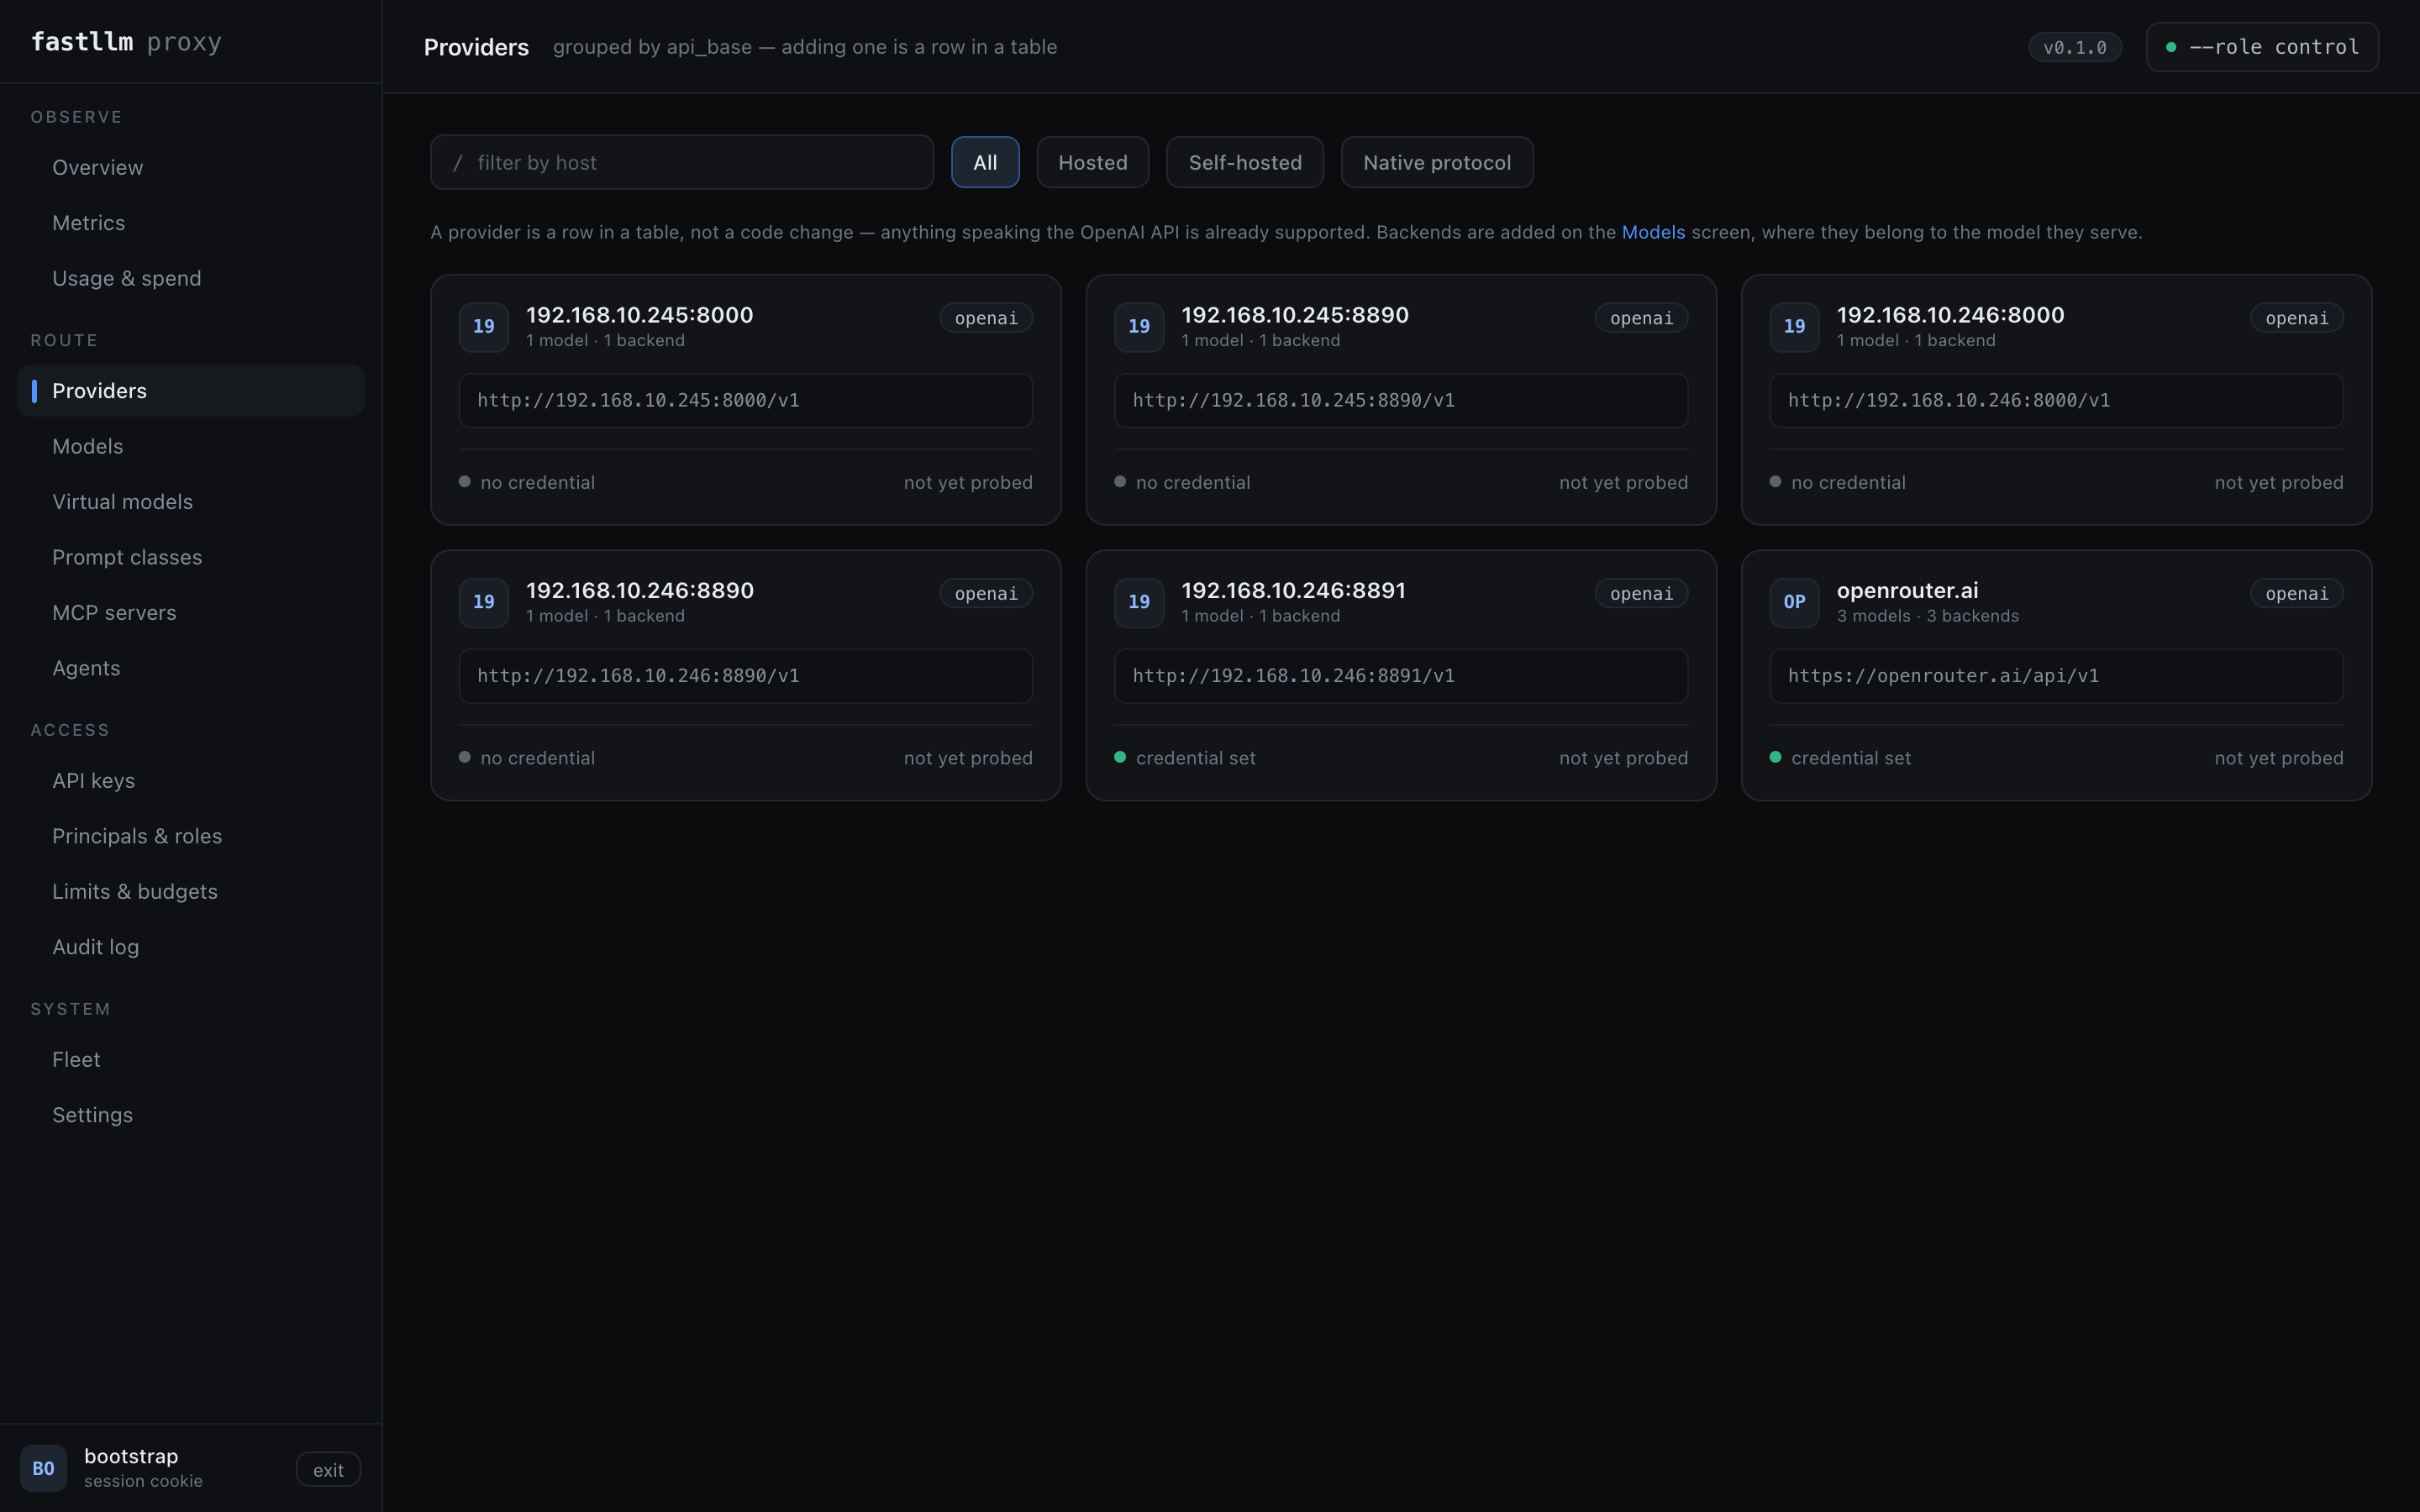
The Providers screen is where an endpoint and its credential are added and
kept. A provider is a row in providers — since migration 0029 it is a record
rather than a grouping the screen used to invent by bucketing backends on their
api_base. Each card answers the question you actually have: how many models
ride on it, whether a credential is set (never the credential itself), and how
many of its models are up.
Add provider offers two ways in, which differ only in where the address comes from:
-
Cloud provider — pick a vendor from the catalogue, which carries every provider named on this page; the list has a filter, because eighty entries is more than anyone wants to scroll. Its wire protocol and the header it wants its key in are filled in for you, and its base URL where that is a fixed, verified address.
Fifty-eight of the eighty-one carry a fixed address, each read off a source that dials it — LiteLLM's
openai_compatible_endpointsand provider configs,go-ai-sdk, or the vendor's own documentation — and the catalogue'snotesrecords which, so that when a vendor moves one there is somewhere to go and check.The other twenty-three carry a
<placeholder>, andPOST /admin/providersrefuses to store an address with one still in it. Those are the cases nobody but you can fill in: a self-hosted engine runs wherever you started it, and an account-scoped endpoint encodes a resource, region, workspace or app that only your account knows (Azure, Bedrock, Vertex, Databricks, Snowflake, Cloudflare, Heroku). The entry still earns its place — it fills in the protocol and the header that vendor wants its key in, which is the half that is easy to get wrong. -
Custom endpoint — type the address of anything else: a vLLM on the LAN, an Ollama on a workstation, a public vendor the catalogue does not list. This is a
staticprovider whether the host is on your network or the internet:cloudmeans we preconfigured it, not that it is somewhere far away. Protocol defaults toopenai, which is what almost everything speaks.
Nothing is served by adding a provider. It carries the endpoint and the credential; which of its models to expose is a separate, deliberate step on Provider models — because a cloud provider can front hundreds, and registering all of them is not what anyone means by adding one.
The catalogue
81 providers work today — 78 reached as-is, 3 through their own wire
format. The count and these tables are checked against each other by
tests/doc_claims.rs, so the number cannot drift away from the rows.
A caveat these tables are explicit about, because the number is otherwise a boast: "works" here means "is a configuration row that this proxy will forward to correctly", which follows from the endpoint being OpenAI-shaped. The ones exercised against real traffic in this repo's tests and on its dev cluster are marked ✓. The rest carry the base URL their vendor documents — check it against their docs before pasting it into production, because vendors move them and this file cannot notice.
| reached as-is (OpenAI-compatible) | |
|---|---|
| OpenRouter ✓ (fronts ~400 models) | https://openrouter.ai/api/v1 |
| OpenAI · Groq · DeepSeek · xAI | api.openai.com · api.groq.com · api.deepseek.com · api.x.ai |
| Together · Fireworks · Nebius · AtlasCloud | four endpoints, four rows |
| Mistral · Perplexity · Cerebras · SambaNova | api.mistral.ai/v1 · api.perplexity.ai · api.cerebras.ai/v1 · api.sambanova.ai/v1 |
| DeepInfra · Novita · Hyperbolic · Lambda | four endpoints, four rows |
| Z.ai · BigModel · Aliyun DashScope · Qwen Cloud | |
| Moonshot / Kimi · Baidu Qianfan · AIHubMix | |
| MiniMax · Volcengine Ark · Tencent Hunyuan · Sarvam | Chinese and Indian clouds, same row shape |
| Baseten · Featherless · FriendliAI · Chutes | |
| Nscale · GMI Cloud · Scaleway · OVHcloud | |
| Cloudflare Workers AI · Vercel AI Gateway · v0 · Poe | |
| NanoGPT · CometAPI · Inception · Morph | |
| Clarifai · Weights & Biases · GradientAI · AI21 | |
| Snowflake Cortex · Anyscale · Heroku · CompactifAI | |
| GitHub Models · GitHub Copilot | |
| Amazon Bedrock | https://bedrock-runtime.<region>.amazonaws.com/openai/v1, Bedrock API key as a bearer token |
| Cohere | https://api.cohere.ai/compatibility/v1 |
| Google Vertex AI | https://<region>-aiplatform.googleapis.com/v1/projects/<project>/locations/<region>/endpoints/openapi — see the API reference for the service-account credential |
| Azure OpenAI · Azure AI | https://<resource>.openai.azure.com/openai/deployments/<deployment> with auth_header: api-key and auth_scheme: "" — the key goes in its own header with no Bearer prefix |
| NVIDIA NIM · Databricks · HuggingFace TGI | integrate.api.nvidia.com/v1 · a serving endpoint · any TGI /v1 |
| vLLM ✓ · SGLang · llama.cpp ✓ · Ollama | self-hosted, same row shape |
| LM Studio · KoboldCpp · TabbyAPI · text-generation-webui | local servers, same row shape |
| Xinference · Llamafile · Docker Model Runner · Lemonade | local servers, same row shape |
| Voyage AI · Jina AI · Infinity · TEI | embeddings and rerank — /v1/embeddings, /v1/rerank |
| reached through their own wire format | |
|---|---|
| Anthropic | "protocol": "anthropic" — Messages API, x-api-key, SSE re-framed to OpenAI chunks |
| Gemini | "protocol": "gemini" — generateContent, model in the URL, x-goog-api-key |
| Z.ai (coding plan) | "protocol": "anthropic" at https://api.z.ai/api/anthropic — catalogue key zai_coding_anthropic; an Anthropic-frontend client is passed through natively, which is what the plan's client fingerprinting requires. The endpoint has no /models, so the provider-create probe accepts its 200-wrapped 404 there and nowhere else. The plan's Codex door is separate: Responses API at https://api.z.ai/api/v1 (catalogue zai_coding_responses) — a /v1/responses request to an openai backend there is forwarded byte-exact, so name the frontend model after the upstream id and Codex traffic arrives as Codex sent it |
Picking one
The Provider models screen offers a provider list: choose one and its base URL, protocol and auth header are filled in, so you paste a key and stop.
What is in that list is what this page documents an endpoint for. It names about a hundred providers and gives a host for thirty-odd of them; the rest are counted rather than specified, and seeding them would mean inventing base URLs. A list that confidently prefills a wrong endpoint is worse than one that admits it does not know.
So the list is a convenience, never a limit — anything speaking the OpenAI API
works whether or not it is on it, and the address is always typeable. Two
entries keep <region> placeholders (Bedrock, Vertex) rather than being
prefilled with something that cannot resolve.
Adding one
A provider model is a name plus the providers that serve it, so there are two steps: the endpoint, then what you want off it. A model already registered somewhere can be attached to a second provider as well — that is what puts two hosts in one pool.
In the UI, on Providers, press Add provider and give it a credential. Then on Provider models:
press Add model. The dialog asks for the provider first, then reads that
endpoint's own answer to GET /v1/models and offers what it serves — not what
a catalogue believes it offers — with the ones you have already registered
marked. Pick one and the local name is filled in from it, editable before
anything is created.
The order matters: naming a model first and finding it an address afterwards leaves a model that routes nowhere in between, and asks you to know the upstream name from memory before anything has offered it.
A provider that does not implement /v1/models says so in the dialog, and the
upstream name stays typeable. Both writes are one intent: if attaching fails,
the model created a moment earlier is removed rather than left behind as a
name that routes nowhere and blocks the retry with a duplicate-name conflict.
By API, the same three calls:
# The endpoint and its key, once. A catalogue_key fills in the rest.
curl -sk -b /tmp/ck -X POST https://control:4001/admin/providers \
  -H 'content-type: application/json' \
  -d '{"catalogue_key":"openrouter","upstream_api_key":"sk-or-..."}'   # -> {"id":3}

curl -sk -b /tmp/ck -X POST https://control:4001/admin/provider-models \
  -H 'content-type: application/json' -d '{"name":"kimi-k2"}'          # -> {"id":7}

curl -sk -b /tmp/ck -X POST https://control:4001/admin/provider-models/7/backends \
  -H 'content-type: application/json' \
  -d '{"provider_id":3,"upstream_model":"moonshotai/kimi-k2"}'
Naming a provider_id settles the address, the protocol and the credential, so
none of them may be sent alongside it — the API refuses rather than quietly
preferring one source, which would leave you believing you had set a key here
while the provider's is what actually gets sent.
Attaching by address still works, and still finds or creates a provider from it. That is how every backend was attached before providers were records, and it is what a LiteLLM import and every existing script does:
curl -sk -b /tmp/ck -X POST https://control:4001/admin/provider-models/7/backends \
  -H 'content-type: application/json' -d '{
    "api_base": "https://api.moonshot.ai/v1",
    "upstream_model": "moonshot-v1-128k",
    "upstream_api_key": "sk-..."
  }'
Pinned headers. extra_headers — on the backend attach, on
POST /admin/providers, or on PATCH /admin/providers/{id} — is an object of
name → value that every request to that provider carries, overriding the
client's own header of the same name. The reason it exists: some endpoints
judge a request by headers the caller used to supply, and user-agent is the
one that comes up — Z.ai's coding plan refuses a key whose traffic does not
look like Claude Code, and a pinned agent string is the part of that
appearance the proxy can be told:
curl -sk -b /tmp/ck -X PATCH https://control:4001/admin/providers/3 \
  -H 'content-type: application/json' \
  -d '{"extra_headers": {"user-agent": "claude-cli/2.0.14 (external, cli)"}}'
A header that no client of the deployment sends is the honest case for this — it makes the proxy say what the operator decided, not fake what the client is. The body a non-Anthropic client sends still reads as what it is.
Posting that a second time against the same model with a different provider
attaches it there too, and the two form one pool: the proxy chooses between
them per request, which is what lets prefix-cache affinity send a conversation
back to the machine that already has it warm. Two entries sharing a
model_name in a LiteLLM config
import
to exactly that shape. Attaching the same provider twice is a 409: routing
would treat it as two machines and send half the traffic to one it had already
counted.
Prices, upstream_model and default_max_tokens live on the attachment rather
than the model, because all three are facts about the provider — the same
weights cost different amounts at different vendors, OpenRouter calls it
google/gemini-2.5-flash where Google calls it gemini-2.5-flash, and only
some providers demand a max_tokens. PATCH /admin/backends/{id} changes
them; DELETE /admin/backends/{id} detaches one provider and leaves the model,
its history and the provider itself alone.
Balancing between different models — failover, traffic splitting, spilling to the cloud — is a frontend model's job instead; see frontend models.
Credentials
upstream_api_key is encrypted at rest with FASTLLM_ENCRYPTION_KEY before it
reaches Postgres, and the admin API never reads one back — the UI shows
whether a credential is set, never what it is.
One credential per provider, however many models ride on it. That is the
point of the split: rotating a key is one write, from the provider card's
rotate key, or PATCH /admin/providers/{id} with a new
upstream_api_key — not one write per model. An absent upstream_api_key
there leaves the stored one alone, so renaming a provider does not require
re-sending a key nothing can read back; "" clears it.
Two knobs exist because not every vendor puts the key in authorization: Bearer:
auth_header | the header name. Default authorization |
auth_scheme | the prefix. Default Bearer; "" sends the key bare |
Azure OpenAI is the case that needs both: auth_header: api-key and
auth_scheme: "". Amazon Bedrock, despite the reputation, needs neither —
its OpenAI-compatible endpoint takes a Bedrock API key as an ordinary bearer
token, so it is a plain row like any other and there is no request signing.
Two providers speak their own language
Anthropic and Gemini do not expose an OpenAI-shaped endpoint, so they are reached through a translator rather than a base URL:
flowchart LR
    C["client<br/>OpenAI request"] --> P{"backend<br/>protocol?"}
    P -->|openai| B1["upstream<br/>bytes forwarded unchanged"]
    P -->|"anthropic +<br/>OpenAI client"| T1["translate →<br/>Messages API<br/>x-api-key"] --> B2["api.anthropic.com"]
    P -->|"anthropic +<br/>Anthropic client"| B4["upstream<br/>bytes forwarded unchanged<br/>(native passthrough)"]
    P -->|gemini| T2["translate →<br/>generateContent<br/>model in the URL"] --> B3["generativelanguage<br/>.googleapis.com"]
    B1 --> R1["response returned<br/>byte-for-byte"]
    B2 --> R2["SSE re-framed<br/>to OpenAI chunks"]
    B3 --> R2
Tool calling translates in both directions, streaming included, as do image
and audio inputs. Translation is opt-in per backend: it costs parsing, and
the whole latency argument for this gateway rests on not parsing. An openai
backend's response body is never deserialised, which is why the two paths in
that diagram are drawn differently — one forwards bytes, the other builds
them.
The translation limits, field by field, are in the API reference.
Verified base URLs
Most providers are OpenAI-compatible, so they need no code at all — just a backend row pointing at their base URL. That includes OpenRouter, which itself fronts Anthropic, Gemini and several hundred other models in OpenAI format:
curl -X POST https://control/admin/provider-models/$MODEL_ID/backends \
  -H 'content-type: application/json' -b "$SESSION" \
  -d '{"api_base":"https://openrouter.ai/api/v1",
       "upstream_model":"anthropic/claude-sonnet-4",
       "upstream_api_key":"sk-or-..."}'
Verified base URLs for the OpenAI-compatible set:
| provider | api_base |
|---|---|
| OpenRouter | https://openrouter.ai/api/v1 |
| OpenAI | https://api.openai.com/v1 |
| Groq | https://api.groq.com/openai/v1 |
| DeepSeek | https://api.deepseek.com/v1 |
| xAI | https://api.x.ai/v1 |
| Together | https://api.together.xyz/v1 |
| Fireworks | https://api.fireworks.ai/inference/v1 |
| Nebius | https://api.studio.nebius.ai/v1 |
| AtlasCloud | https://api.atlascloud.ai/v1 |
| AIHubMix | https://aihubmix.com/v1 |
| Z.ai | https://api.z.ai/api/paas/v4 |
| BigModel | https://open.bigmodel.cn/api/paas/v4 |
| Aliyun DashScope | https://dashscope.aliyuncs.com/compatible-mode/v1 |
| Qwen Cloud | https://dashscope-intl.aliyuncs.com/compatible-mode/v1 |
| Moonshot / Kimi | https://api.moonshot.cn/v1, https://api.moonshot.ai/v1 |
| Baidu Qianfan | https://qianfan.baidubce.com/v2 |
| GitHub Models | https://models.github.ai/inference |
| Ollama | http://localhost:11434 |
| Cohere | https://api.cohere.ai/compatibility/v1 |
| Amazon Bedrock | https://bedrock-runtime.<region>.amazonaws.com/openai/v1 |
| Google Vertex AI | https://<region>-aiplatform.googleapis.com/v1/projects/<project>/locations/<region>/endpoints/openapi |
Bedrock needs no request signing. Its OpenAI-compatible endpoint takes a
Bedrock API key as an ordinary bearer token, so it is a plain backend row like
any other — create the key in the Bedrock console and put it in
upstream_api_key.
What is deliberately absent
Deliberately absent, and not counted: providers whose API is not OpenAI-shaped and would need a fourth translator in src/protocol/ — Replicate, Predibase, Petals, Triton, WatsonX, OCI Generative AI, AWS SageMaker. Also absent are the non-LLM services a gateway has no business proxying blind: speech (Deepgram, ElevenLabs), image generation (Stability, Black Forest Labs, Recraft, Fal, RunwayML), vector stores (Milvus), and other people's gateways (Helicone, LiteLLM itself). Counting those would inflate the number without making anything work.
Where next
| API and administration | Verified base URLs, and the per-field translation limits |
| What it can do | Routing between providers, not just to them |
| Operations | Where the encryption key lives, and why it cannot be regenerated |
MCP gateway
One endpoint in front of every tool server, for the same reason there is one in front of every model.
A team running four MCP servers otherwise hands every agent four addresses,
four credentials and four separate trust decisions — and has nowhere to answer
"which of our keys can reach the one that writes to production". Here a server
is a row, a grant is mcp:invoke on mcp/<name>, and that question is the
same query it already is for models.
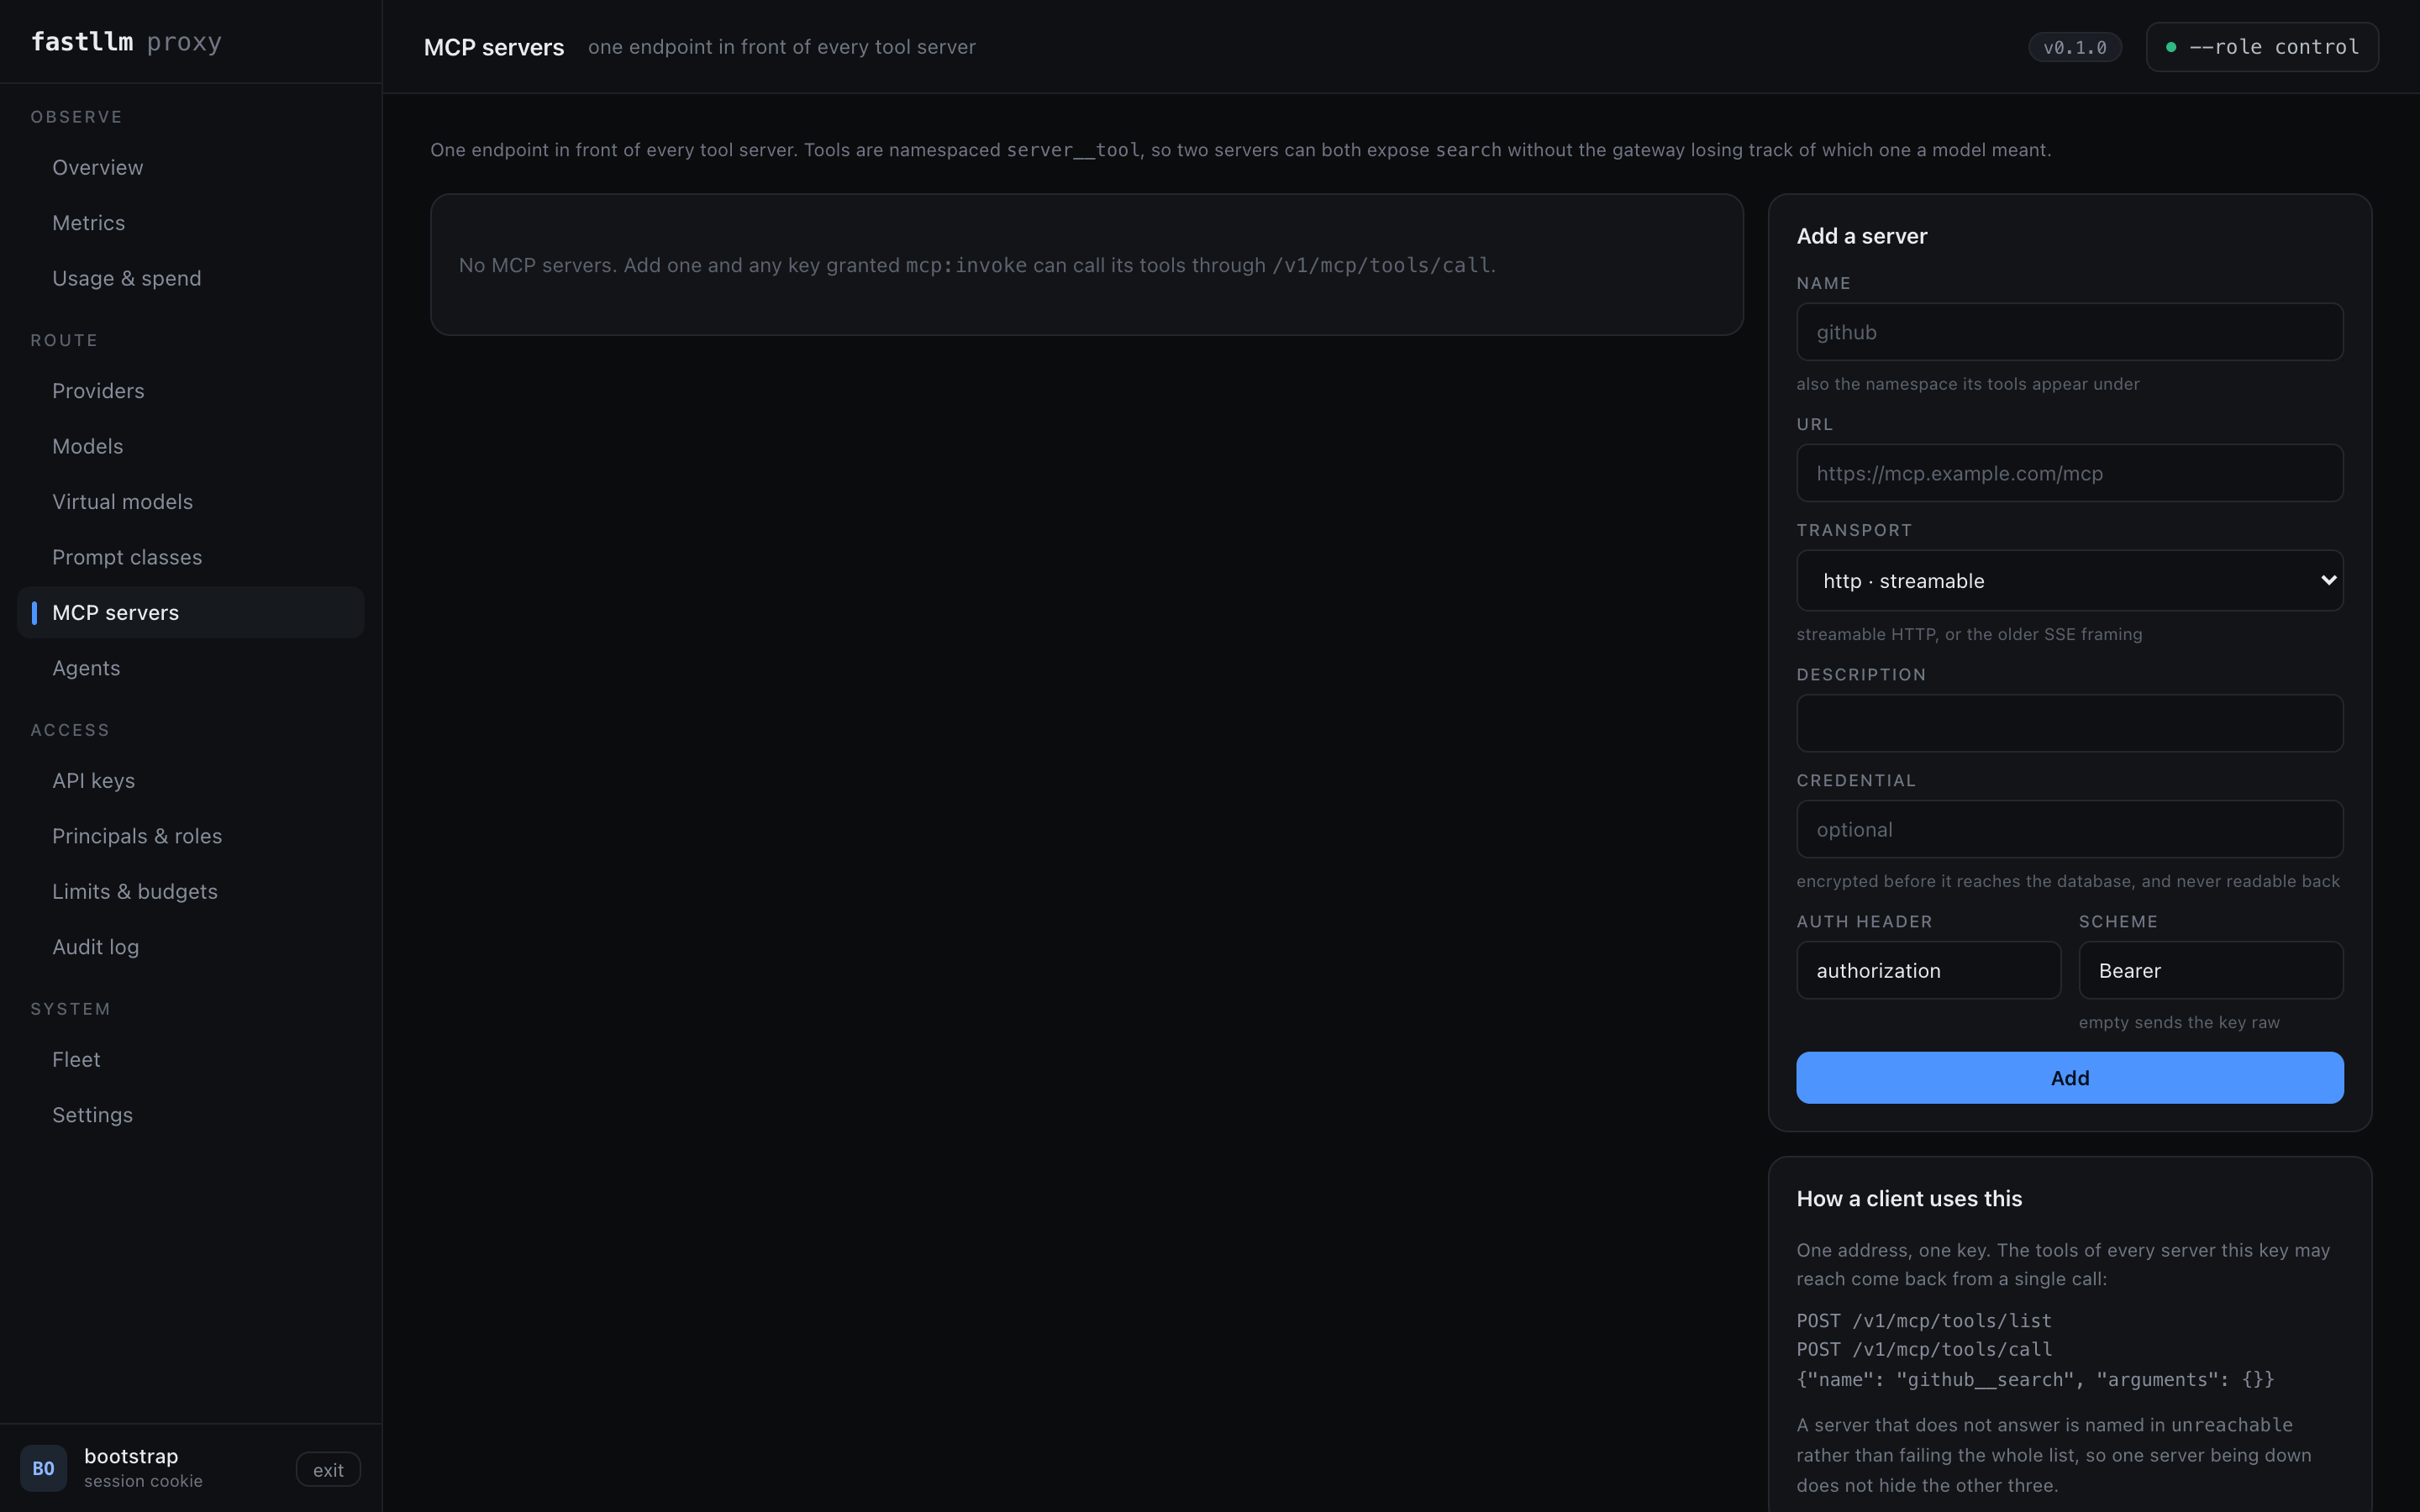
Adding one
In the UI on MCP servers, or by API:
curl -sk -b /tmp/ck -X POST https://control:4001/admin/mcp-servers \
  -H 'content-type: application/json' -d '{
    "name": "github",
    "url": "https://mcp.github.example/mcp",
    "transport": "http",
    "upstream_api_key": "ghp_..."
  }'
| field | |
|---|---|
name | What callers address it by, and the namespace its tools appear under. Alphanumeric with - or _ |
url | The server's endpoint |
transport | http (MCP's streamable HTTP) or sse |
auth_header | Defaults to authorization |
auth_scheme | Defaults to Bearer; "" sends the credential raw, which several MCP hosts want |
upstream_api_key | Encrypted with FASTLLM_ENCRYPTION_KEY before it reaches Postgres, and never readable back |
Adding a server grants nobody anything. It is reachable only by a
principal holding mcp:invoke on mcp/<name> or mcp/* — see
access below.
Calling it
Three endpoints on the gateway (:4000), authenticated with an ordinary
sk-… key:
# What this key may reach. Answered from memory — no upstream call.
curl -H "authorization: Bearer sk-..." http://gateway:4000/v1/mcp/servers

# Every tool across every server this key may reach.
curl -XPOST -H "authorization: Bearer sk-..." http://gateway:4000/v1/mcp/tools/list

# Invoke one.
curl -XPOST http://gateway:4000/v1/mcp/tools/call \
  -H "authorization: Bearer sk-..." -H 'content-type: application/json' \
  -d '{"name": "github__search", "arguments": {"q": "is:open label:bug"}}'
Tools are namespaced, and it matters
Every tool comes back as <server>__<tool>:
{
  "object": "list",
  "data": [
    {"name": "github__search", "server": "github", "description": "...", "inputSchema": {...}},
    {"name": "jira__search",   "server": "jira",   "description": "...", "inputSchema": {...}}
  ],
  "unreachable": []
}
Two servers exposing search is the ordinary case, not the exotic one. A tool
name is what the model emits in a tool call, so a collision is not a
listing problem — it is the gateway being unable to tell which server the
model meant, after the fact, with no way to ask. An un-namespaced name is
refused with 400 rather than guessed, because guessing means a tool call
landing somewhere the caller did not name. MCP's own spec reached the same
conclusion in SEP-986.
The namespace is stripped on the way out. The server knows its tools by their own names and has never heard of this gateway's prefix.
One server being down does not hide the others
unreachable names the servers that did not answer, and the tools of the ones
that did are still returned. Four servers with one down should still list the
tools on the other three, and a missing tool should be diagnosable rather than
merely absent.
A tools/call to a server that fails answers 502, not 500: the failure is
upstream, and behind one address that is exactly the distinction a client
needs.
Access
Grants use the same machinery as models, and are deliberately separate from them:
# Every server
curl -sk -b /tmp/ck -X POST https://control:4001/admin/roles/agents/permissions \
  -H 'content-type: application/json' -d '{"verb":"mcp:invoke","resource":"mcp/*"}'

# Or exactly one
  -d '{"verb":"mcp:invoke","resource":"mcp/github"}'
model:invoke does not imply mcp:invoke. A key that may invoke every
model is not, by that fact, a key that may reach every tool server: tools have
side effects and models do not. The seeded inference role gets models and
not tools; only admin gets both.
A server the caller may not reach answers 404, exactly as one that does not exist. An unauthorised caller learns nothing about what the deployment runs.
Handing the tools to a model
The catalogue comes back in a shape any OpenAI-compatible model accepts, which is the point of putting a gateway here at all:
tools = requests.post(f"{BASE}/v1/mcp/tools/list",
                      headers={"authorization": f"Bearer {KEY}"}).json()["data"]

openai_tools = [{"type": "function", "function": {
    "name": t["name"], "description": t.get("description", ""),
    "parameters": t.get("inputSchema", {"type": "object"})}} for t in tools]

resp = client.chat.completions.create(model="my-model", messages=msgs, tools=openai_tools)

# The model emits `github__search`; hand it straight back to the gateway.
for call in resp.choices[0].message.tool_calls or []:
    requests.post(f"{BASE}/v1/mcp/tools/call",
                  headers={"authorization": f"Bearer {KEY}"},
                  json={"name": call.function.name,
                        "arguments": json.loads(call.function.arguments)})
The same key authenticates the model call and the tool call, and both are authorised against the same principal — which is what makes "who used which tool" answerable at all.
What is deliberately absent
stdio servers. A gateway that spawns a process on behalf of a request is
a different trust boundary from one that forwards HTTP, and this proxy runs
with a read-only root filesystem and no shell for reasons that still apply. A
stdio server belongs behind an HTTP transport that someone else operates.
Automatic tool execution inside /chat/completions. LiteLLM will run
returned tool calls and feed the results back when require_approval is
"never". That turns one request into an unbounded number of upstream calls
with no budget attached, on a path whose entire design is that it does not
block. The loop belongs in the client, where it can be seen; the example above
is six lines.
Prompts and resources. MCP has both. Tools are what agents actually use and what needs authorising; the other two can follow when something asks for them rather than shipping as surface nobody calls.
Where next
| Security | Where the credential lives, and what /snapshot carries |
| Interactive API reference | The three endpoints and their responses |
| Providers | The same idea for models |
A2A agents
One address in front of every agent. The same argument as the MCP gateway, one step further out: an agent acts — it runs, it calls tools, it spends money — so "which of our keys may set which agent running" is a question somebody eventually has to answer.
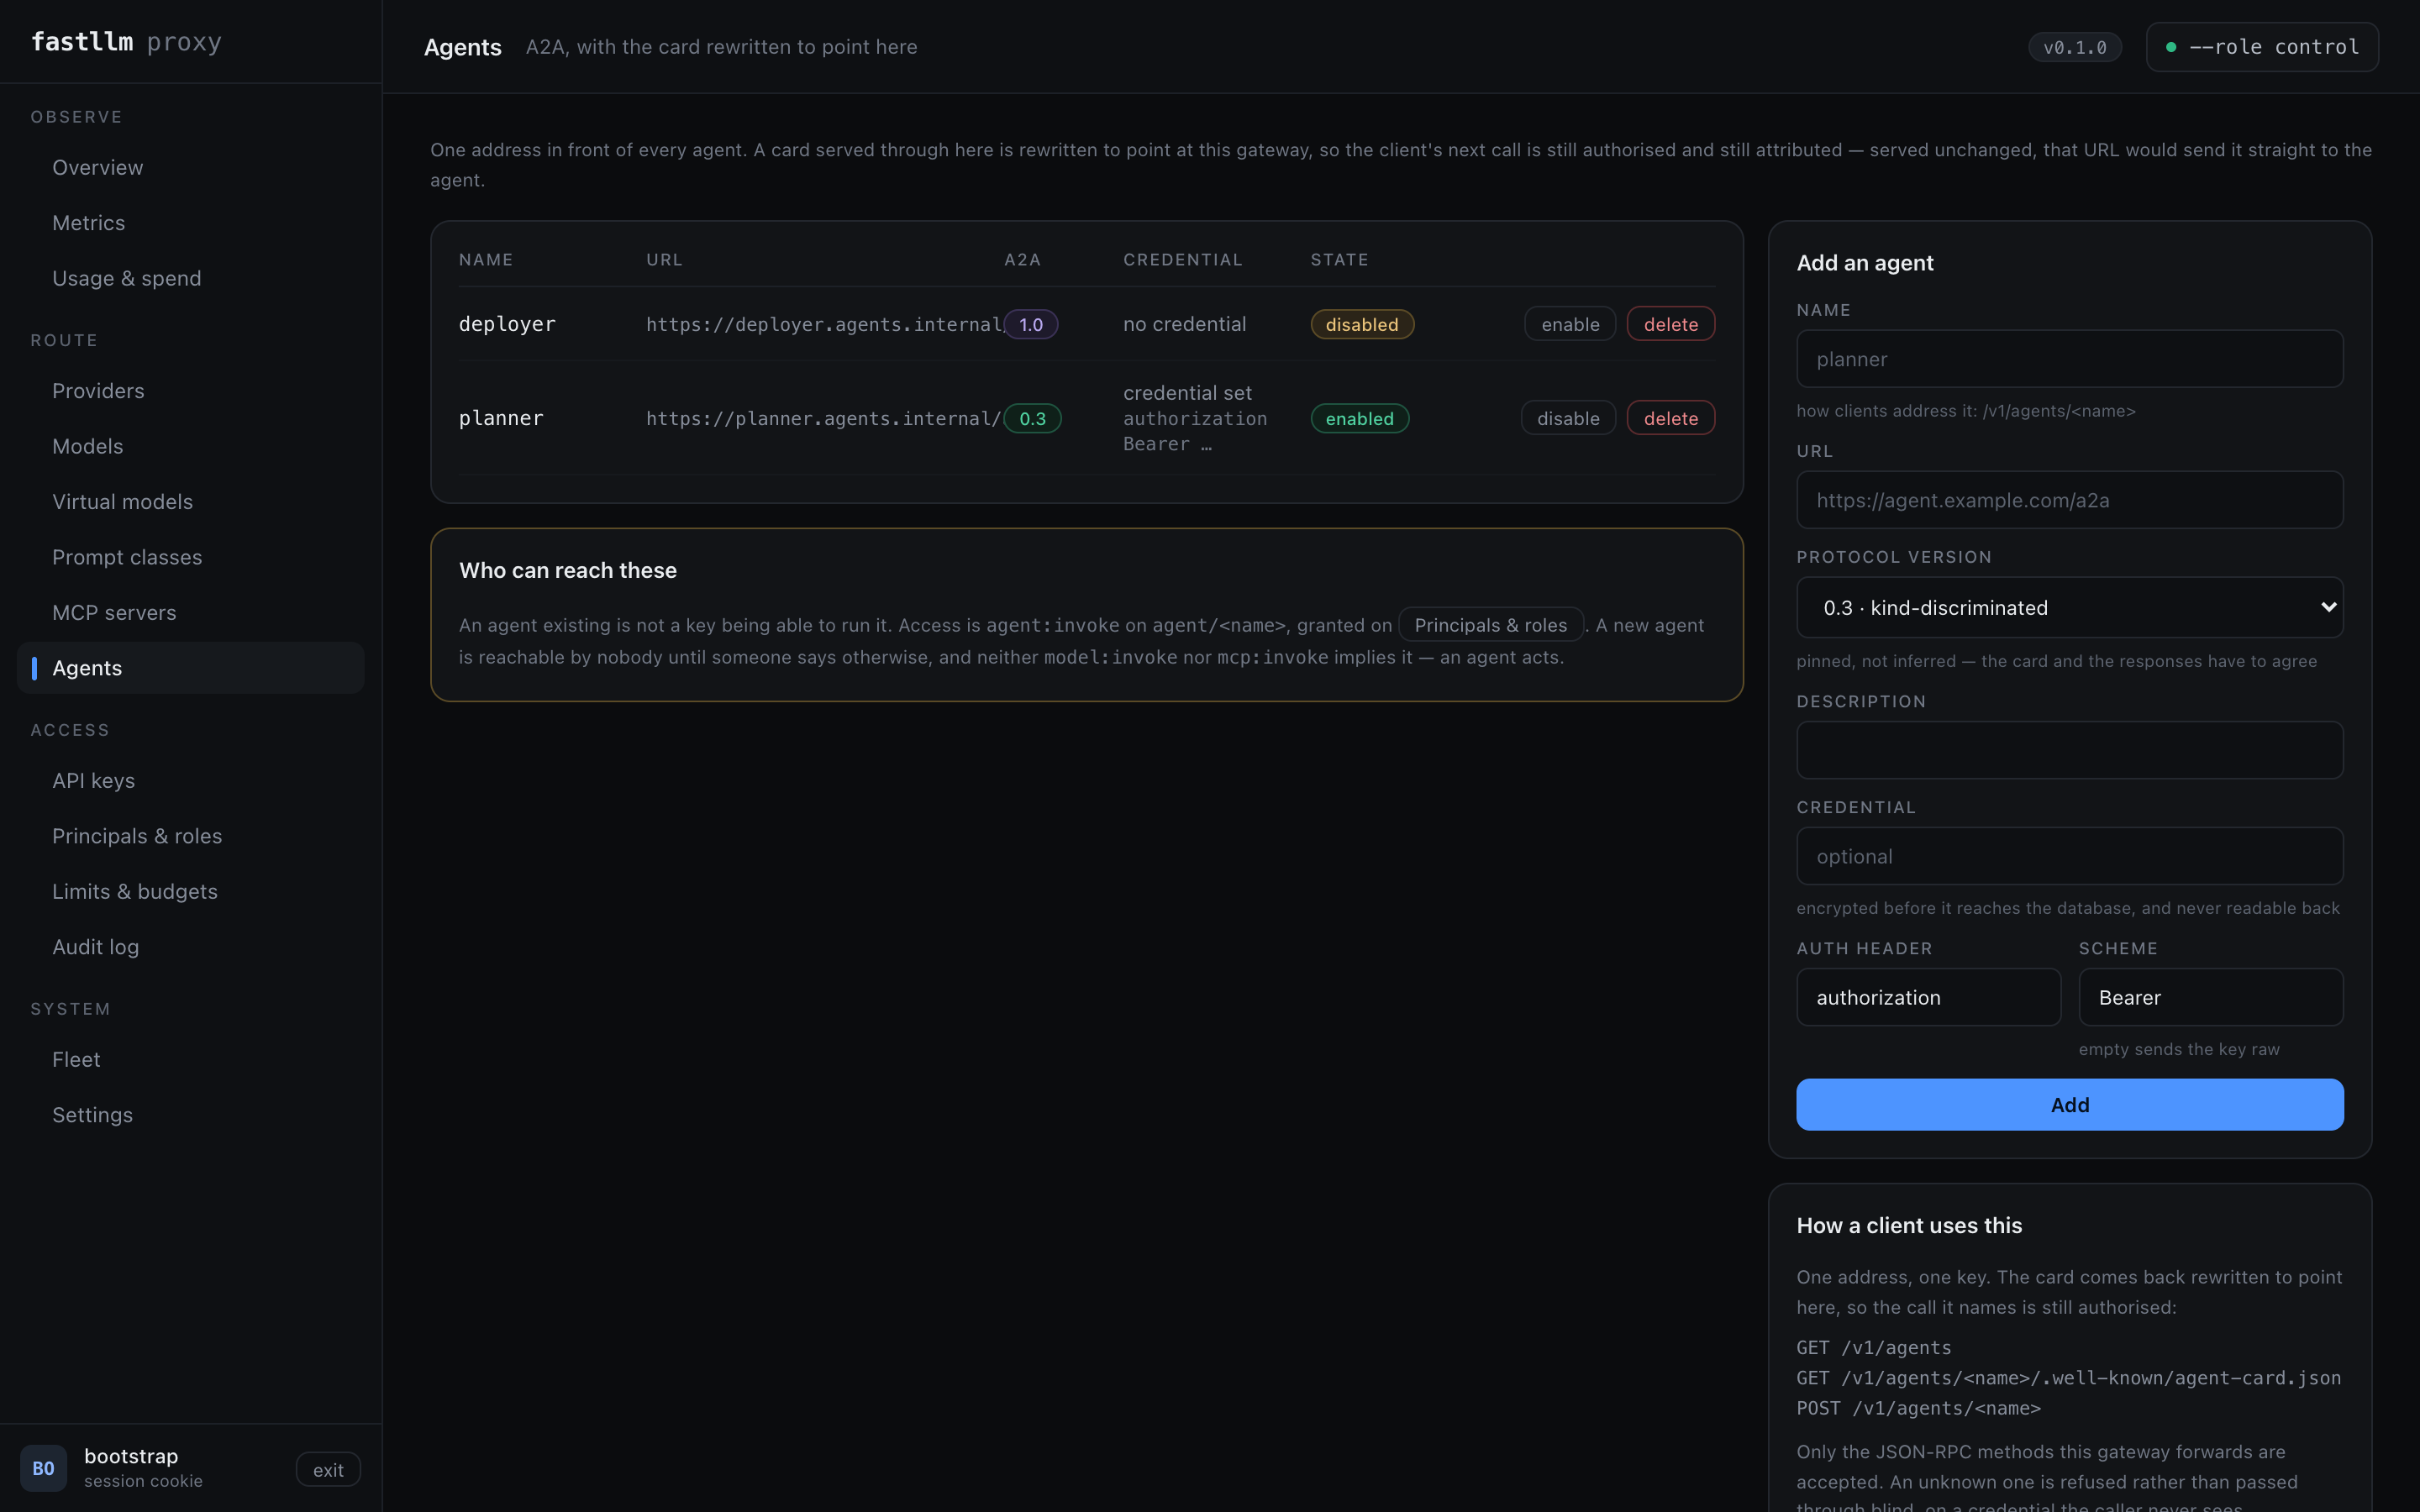
Add one on Agents, or by API:
curl -sk -b /tmp/ck -X POST https://control:4001/admin/a2a-agents \
  -H 'content-type: application/json' -d '{
    "name": "planner",
    "url": "https://planner.agents.internal/a2a",
    "protocol_version": "0.3",
    "upstream_api_key": "..."
  }'
| field | |
|---|---|
name | Addressed as /v1/agents/<name> |
url | The agent's A2A endpoint |
protocol_version | 0.3 or 1.0, pinned — see below |
auth_header / auth_scheme | As for any upstream; "" sends the credential raw |
upstream_api_key | Encrypted at rest, never readable back |
Calling one
# What this key may run.
curl -H "authorization: Bearer sk-..." http://gateway:4000/v1/agents

# The card — rewritten to point here.
curl -H "authorization: Bearer sk-..." \
  http://gateway:4000/v1/agents/planner/.well-known/agent-card.json

# Every JSON-RPC method, on one path.
curl -XPOST http://gateway:4000/v1/agents/planner \
  -H "authorization: Bearer sk-..." -H 'content-type: application/json' \
  -d '{"jsonrpc":"2.0","id":1,"method":"message/send",
       "params":{"message":{"role":"user","parts":[{"kind":"text","text":"plan it"}]}}}'
The card is rewritten, and that is the point
A client fetches an agent card and then talks to whatever url it names.
Served unchanged, that URL is the agent — so the client's next request goes
straight past the key check and the spend attribution, and this becomes a
discovery service rather than a gateway.
The card served here names this gateway, and carries the agent's pinned
protocolVersion rather than whatever the upstream claimed. Everything else
in the card is passed through untouched.
The gateway's address is taken from the request's Host rather than
configured: a deployment sits behind a Service, a VIP, an Ingress and a
port-forward at different times, and one configured base URL is wrong for
three of those.
Versions are pinned, never inferred
A2A 0.3 discriminates objects by kind. 1.0 uses protobuf JSON envelopes with
PascalCase method names. A gateway can infer which one a client wants from
the method it called, and LiteLLM does — but an inference means the agent card
can say one thing while the response is the other, and a client that has
already branched on the card is then wrong in a way that looks like the agent
misbehaving.
So the version is a column. This gateway forwards; it does not translate between versions. If your agent speaks 0.3 and your client wants 1.0, that is a translator, and it is not written. Stating that is the point — a gateway that silently half-does it is worse than one that does not.
Only known methods are forwarded
| 0.3 | 1.0 |
|---|---|
message/send, message/stream | SendMessage, SendStreamingMessage |
tasks/get, tasks/list, tasks/cancel, tasks/resubscribe | GetTask, ListTasks, CancelTask, TaskSubscription |
agent/getAuthenticatedExtendedCard | GetAgentCard |
Anything else is a 400. An unknown method forwarded blind is a request whose
effects nobody here can describe, made with a credential the caller never
sees. Adding one is a line of code, once somebody can say what it does.
message/stream is forwarded without being buffered, the same as a completion
— inspecting it would defeat streaming for exactly the same reason.
Access
curl -sk -b /tmp/ck -X POST https://control:4001/admin/roles/agents/permissions \
  -H 'content-type: application/json' -d '{"verb":"agent:invoke","resource":"agent/planner"}'
agent/* for every agent. Neither model:invoke nor mcp:invoke implies
it — an agent acts, and being allowed to call a model or read a tool server
says nothing about that. The seeded inference role does not get it; only
admin does.
An agent the caller may not reach answers 404, exactly as one that does not
exist.
Where next
| MCP gateway | The same idea for tool servers |
| Security | Where the credential lives, and what /snapshot carries |
| Interactive API reference | The three routes and their responses |
Connecting a client
Everything here is an OpenAI-compatible endpoint, so anything that talks to OpenAI talks to this. What follows is the exact configuration for the clients people actually point at it, so nobody has to work it out from first principles.
Two constants throughout:
| Base URL | http://<host>:4000/v1 — the data plane. Not the admin port |
| API key | a key minted through the admin API or the UI, sk-… |
The admin port (4001) serves the management UI, /admin/* and /snapshot. No
client should ever be pointed at it.
The OpenAI SDKs
from openai import OpenAI

client = OpenAI(base_url="http://gateway:4000/v1", api_key="sk-...")
client.chat.completions.create(
    model="my-model",
    messages=[{"role": "user", "content": "hi"}],
)
import OpenAI from "openai";

const client = new OpenAI({
  baseURL: "http://gateway:4000/v1",
  apiKey: "sk-...",
});
await client.chat.completions.create({
  model: "my-model",
  messages: [{ role: "user", content: "hi" }],
});
Streaming, tool calling, response_format, images and audio all work as they
do against OpenAI — an openai-protocol backend's body is forwarded
unmodified in both directions, so anything the upstream supports survives the
trip.
Coding agents
These are the ones worth spelling out, because each expects its own file.
opencode
~/.config/opencode/opencode.json:
{
  "$schema": "https://opencode.ai/config.json",
  "provider": {
    "fastllm": {
      "npm": "@ai-sdk/openai-compatible",
      "name": "fastllm",
      "options": {
        "baseURL": "http://gateway:4000/v1",
        "apiKey": "{env:FASTLLM_API_KEY}"
      },
      "models": {
        "my-model": { "name": "My Model" }
      }
    }
  }
}
List only the models that key may invoke. /v1/models is filtered by the
caller's grants, but opencode builds its picker from this file, so a model
listed here that the key cannot use fails when selected.
Cursor
Settings → Models → Override OpenAI Base URL with http://gateway:4000/v1,
and paste the key as the OpenAI API key. Cursor verifies the key by calling
/v1/models, so the key needs a grant on at least one model or verification
fails.
Continue (~/.continue/config.json)
{
  "models": [
    {
      "title": "fastllm",
      "provider": "openai",
      "model": "my-model",
      "apiBase": "http://gateway:4000/v1",
      "apiKey": "sk-..."
    }
  ]
}
Aider
export OPENAI_API_BASE=http://gateway:4000/v1
export OPENAI_API_KEY=sk-...
aider --model openai/my-model
Zed (settings.json)
{
  "language_models": {
    "openai": {
      "api_url": "http://gateway:4000/v1",
      "available_models": [{ "name": "my-model", "max_tokens": 262144 }]
    }
  }
}
Frameworks
LangChain
from langchain_openai import ChatOpenAI

llm = ChatOpenAI(
    base_url="http://gateway:4000/v1",
    api_key="sk-...",
    model="my-model",
)
LlamaIndex
from llama_index.llms.openai_like import OpenAILike

llm = OpenAILike(
    api_base="http://gateway:4000/v1",
    api_key="sk-...",
    model="my-model",
    is_chat_model=True,
)
OpenAILike rather than OpenAI: the latter refuses model names it does not
recognise from OpenAI's own catalogue, and yours will not be in it.
Vercel AI SDK
import { createOpenAICompatible } from "@ai-sdk/openai-compatible";

const fastllm = createOpenAICompatible({
  name: "fastllm",
  baseURL: "http://gateway:4000/v1",
  apiKey: process.env.FASTLLM_API_KEY,
});
Embeddings and rerank
Same endpoint, same key, subject to the same per-model grants:
client.embeddings.create(model="bge-m3", input="hello")
curl http://gateway:4000/v1/rerank -H "authorization: Bearer sk-..." \
  -H 'content-type: application/json' \
  -d '{"model":"bge-reranker-v2-m3","query":"q","documents":["a","b"]}'
/v1/rerank and /v1/score are forwarded like any other POST carrying a
model; they are not OpenAI endpoints, but every engine that implements them
uses the same shape.
Images
client.images.generate(model="dall-e-3", prompt="a red bicycle", size="1024x1024")
curl http://gateway:4000/v1/images/generations -H "authorization: Bearer sk-..." \
  -H 'content-type: application/json' \
  -d '{"model":"dall-e-3","prompt":"a red bicycle","size":"1024x1024"}'
/v1/images/edits too. Binary and base64 responses go through the same byte
pump as a token stream — nothing on the response path parses a passthrough
body, whatever is in it.
Speech
Text to speech, and both directions of transcription:
client.audio.speech.create(model="tts-1", voice="alloy", input="hello")
client.audio.transcriptions.create(model="whisper-1", file=open("clip.mp3", "rb"))
client.audio.translations.create(model="whisper-1", file=open("clip.mp3", "rb"))
The transcription endpoints take a multipart upload, and the client's
content-type is carried through untouched — the boundary parameter lives in
that header, and rewriting it would make the body unparseable upstream.
Each of these is the same one-row configuration as a chat model, authorised by the same per-model grant and counted in the same usage accounting.
Observability
Prometheus
/metrics on the data plane port, behind the same API keys as everything else
— it names every backend's api_base and how much traffic each carries, which
is not something to hand out to whoever asks. Any valid key will do; give the
scraper one of its own so revoking it cannot take a model offline:
scrape_configs:
  - job_name: fastllm-proxy
    authorization:
      type: Bearer
      credentials_file: /etc/prometheus/fastllm-key # a key minted for scraping
    static_configs:
      - targets: ["gateway:4000"]
A deployment running open (no authentication anywhere) serves it to anyone,
since there is nothing there to keep from whom.
Per-backend health, in-flight, request and error counts, latency histograms,
cache counters, classifier timings and the snapshot version. A ready-made
Grafana dashboard is in examples/grafana-dashboard.json.
OpenTelemetry
Built with --features otel, then --otel-endpoint http://collector:4317.
Sampling is one-in-N via --otel-sample-one-in, because tracing every request
on a hot path is its own performance problem.
Both transports are compiled in and the endpoint chooses between them: :4317
is gRPC, a /v1/traces path or :4318 is HTTP. --otel-protocol grpc|http
overrides when something in front hides both signals.
A hosted backend needs headers, and that is what --otel-header is for —
repeatable, or FASTLLM_OTEL_HEADERS=k=v,k2=v2. Braintrust wants two:
--otel-endpoint https://api.braintrust.dev/otel/v1/traces
--otel-header "Authorization=Bearer $BRAINTRUST_API_KEY,x-bt-parent=project_id:$PROJECT"
Header values are credentials, so they are never written to a log — the
startup line reports how many headers there are, not what they say. In the
chart, prefer otel.headersSecret over otel.headers: the map form lands in
the PodSpec, which anyone who can get pod can read.
A Collector is still the right answer for fanning out to several backends. It should not be the price of reaching one.
Webhooks
--webhook-url POSTs JSON when a backend goes down or recovers, or when a
snapshot rebuild fails. --webhook-secret signs it with HMAC-SHA256 in
x-fastllm-signature. A minimal receiver that verifies the signature is in
examples/webhook-receiver.py.
Per-caller detail
Prometheus deliberately does not carry per-principal labels — that cardinality
is how a metrics endpoint becomes an outage. "Which caller got slow" is a SQL
question against usage_events, or the Usage & spend screen in the UI.
See operations.md.
Coming next
The stateful job APIs — /v1/batches, /v1/files, /v1/fine_tuning and the
Assistants API — and provider-native passthrough paths such as
/vertex-ai/....
Both need one new idea rather than one more route. Everything served today
carries a model in its body, which is what the router routes on and what the
per-model grant is checked against. A GET /v1/files/{id} carries neither, so
supporting it means the gateway remembering which backend owns which id, and
authorising on something other than a model. That is a design worth doing
properly — an id-to-backend map that survives restarts, and grants that can be
expressed per backend rather than per model — and it is on the list.
Until then, call those endpoints against the provider directly; everything your application does per request goes through here.
Troubleshooting
Symptoms people actually hit, and what each one means. Most entries here are failures that happened on a real deployment rather than ones imagined for the page — where a message turned out to be misleading, that is called out, because a wrong explanation costs more than no explanation.
Requests
401 with a key you just created
The key exists in the database but the proxy has not seen it yet. Keys reach
the data plane in the snapshot, which each replica polls on --config-poll
(5s by default), so there is a window of a few seconds after minting.
If it persists: the key may be revoked (GET /admin/keys shows disabled),
expired (expires_at — and note the UI's create form defaults to 90 days,
not never), or you are sending it to the admin port instead of the data plane.
403 model_access_denied
The key is valid; the principal behind it holds no model:invoke grant for
that model. Authentication and authorisation are separate, and a 403 rather
than a 401 is the gateway saying so.
curl -sk -b /tmp/ck https://host:4001/admin/principals   # which roles it holds
curl -sk -b /tmp/ck https://host:4001/admin/roles        # what those roles grant
Grants are per model: model:invoke on model/<name>, or model/* for all,
and the name is a frontend model's — that is what a client asks for and
therefore what is granted.
A grant on a frontend model covers the whole chain it routes to. Adding a
target to it extends the reach of everyone holding it, which is acceptable only
because editing one needs config:write, itself enough to grant any model
outright.
404 for a provider model
Provider models are inventory, not names a client may use. Ask for the frontend
model in front of it — GET /v1/models lists exactly what this key can name.
404 no route for POST /v1/...
That path is not proxied. Twelve POST endpoints carrying a model are; the
stateful job APIs are not, and integrations.md explains why.
429, and x-ratelimit-* headers you did not configure
Rate limits are per principal. GET /admin/limits shows who has one.
Retry-After is in whole seconds and is honest — the bucket really does refill.
402 Payment Required
A budget window is exhausted. Not a rate limit: waiting does not help until the
window rolls over or someone raises the cap. GET /admin/budgets.
502 upstream_unavailable
No backend in the chain could be reached. Check GET /health on the data plane
for per-backend health, or the Fleet screen, which keeps replicas separate —
if one replica sees a backend as down and the others do not, that is a
partition rather than a dead backend, and merging them would hide it.
Requests succeed but the model returns empty content
Reasoning models put their output in reasoning_content until they finish
thinking. A small max_tokens truncates the reasoning before any content
appears, and finish_reason will say length. This is also the most common
cause of "the model will not call tools": a tool call costs ~100 tokens of
reasoning first, so a tight ceiling looks exactly like a model that ignores
tools. Raise max_tokens, or disable thinking:
{ "chat_template_kwargs": { "enable_thinking": false } }
Usage, spend and charts
Usage and spend are empty
Two eras here. Before the accounting change, usage was recorded only for principals with a budget or a tokens-per-minute limit — so a deployment that enforced nothing recorded nothing. Every request is recorded now, for any authenticated caller.
If it is still empty: check that requests are reaching a backend at all
(refusals are recorded separately), and that the control plane is receiving
reports — fastllm_usage_reports_dropped_total on the proxy's /metrics is
non-zero if the queue to the control plane is backing up.
Spend says — or unpriced
The models have no prices. A request against an unpriced model contributes
nothing to a total and is counted as unpriced_requests rather than as zero
cost, so a spend figure never quietly understates. Set prices with
PATCH /admin/provider-models/{id} or the edit form. A self-hosted model legitimately
has no price; a hosted one should have.
The chart says "a control plane older than the accounting change does not serve this"
Take that message with suspicion — it asserts a cause it has not checked.
It appears whenever GET /admin/timeseries fails for any reason, including
a 500. Check the endpoint directly before believing it:
curl -sk -b /tmp/ck 'https://host:4001/admin/timeseries?bucket=3600'
If that returns 500, the control-plane logs have the real reason.
A chart is empty for a window you know had traffic
Empty buckets are returned as explicit zeros, so an empty chart means no rows, not a missing series. Usage older than the retention window (90 days) has been folded into hourly rollups — the counts survive, but rolled-up buckets carry no latency, because percentiles do not merge. A latency line that stops partway back is that boundary, not a gap in traffic.
Admin plane
The browser warns about the certificate
The admin API is served with a certificate from a private CA, which no OS trust store knows. Verifying clients need the CA:
kubectl -n fastllm get secret fastllm-control-tls -o jsonpath='{.data.ca\.crt}' \
  | base64 -d > ca.crt
curl --cacert ca.crt https://host:4001/healthz
For a browser, trust that CA on the machine. Do not habitually click through certificate warnings on an admin plane.
migration N was previously applied but is missing in the resolved migrations
The binary is older than the database schema. Usually a rollback, or a
manifest whose image pin drifted behind what is running. sqlx refuses rather
than running against a schema it does not understand, which is the safe
failure. Deploy the newer image.
A write succeeded but nothing changed
GET /admin/health reports snapshot_rebuild_failures. A write commits and
then the snapshot is rebuilt; if the rebuild fails, the database and the
published configuration have diverged and will stay that way until a later
rebuild succeeds. This is also a webhook event, if one is configured.
One replica behaves differently from the others
Compare snapshot_version per replica on the Fleet screen. A replica on an
older snapshot answers /health with ok and misbehaves only on whatever
changed — most often a key it has never seen.
Disagreement right after a change is normal and is not an alert. Each proxy
polls for a new snapshot every config_poll_seconds and reports its health
every health_report_interval_seconds, so a replica can report the previous
version for the sum of the two — 15s on the defaults — with nothing wrong.
The size of the version gap is not a measure of staleness. A version is the microsecond at which the control plane built that snapshot, and it only republishes when the content actually changed. Two consecutive versions are therefore separated by however long it happened to be between two real changes, so a replica exactly one version behind can show a gap of a second or of a minute with no difference in health. What decides it is time, by either of two signals:
- The newest snapshot has been available longer than a poll and a report can account for (15s on the defaults, plus a small margin). Everyone has had their chance, so anyone still behind is stuck.
- A replica has been behind continuously for longer than that. This is the
one that matters on a busy gateway:
Budget.tokens_usedis part of the snapshot content, so traffic alone republishes it every few seconds and the newest snapshot is never old enough for the first signal to prove anything. Being behind is what persists while the version it is behind of keeps moving.
The Fleet screen says "still picking up the snapshot" until one of those holds and only raises the red banner after, reporting the snapshot's age with it. The second signal only counts time the screen has been open, so leave it open for a few polls before concluding a replica is fine.
Backends
A backend keeps being marked unhealthy
Two separate paths take a backend out of rotation, and they need different
fixes, so find out which one it is before changing anything. On a build with
fa2c79d or later, every ejection logs backend out of rotation with a
reason; on anything older the ejection is silent and the only trace is the
recovery.
-
The health probe (
GET /models,unhealthy_after, default 2). A backend slow enough to exceed--health-timeoutlooks identical to one that is down. For long-loading engines, raise the timeout rather than the failure count. A backend ejected by real traffic (header timeouts, frozen engine counters) stays out for 30s, doubling to 5 minutes, and a passing probe does not shorten that. A model whose backends are all out is still tried, ejected ones last, when there is no further model in its chain to fail over to: a probe is a suspicion and a request is evidence, so a probe-only ejection no longer turns into502 no healthy backendfor a fleet that is serving (#29). -
Upstream header timeouts from real traffic (
consecutive_timeout_threshold, defaulting tounhealthy_after). A request that gets no response headers withinupstream_timeout_secondscounts as a timeout, and that many in a row eject the backend. This is the one that bites a busy local engine: the probe answers in milliseconds while real requests queue inside vLLM long enough to time out, so the backend is ejected with nothing wrong with it. A 35B on one GPU ran a 69% 502 rate this way, serving 13k-token prompts at 37s average first byte against a default budget.Fix it in this order: set the backend's upstream timeout (Models page, FLOW CONTROL, or
upstream_timeout_secondsonPATCH /admin/backends/{id}) above the real p99 time-to-first-byte; have the caller stream, which makes first byte arrive in seconds regardless of generation length; raiseconsecutive_timeout_thresholdindependently ofunhealthy_after; and set flow control on the backend (Models page, FLOW CONTROL) so the queue forms in the proxy, bounded, instead of inside the engine.
A backend shared by several models -- a pool is a policy over an existing model's backend, not a copy of it -- is one object with one health bit. Traffic through the pool ejecting it takes the model down too, and that is correct: it is the same engine.
A backend stays out of rotation although the engine answers
If an ejected backend never logs backend healthy, back in rotation while its
engine answers /v1/models in milliseconds, check that the prober is running
at all. Look at the engine's own access log: each proxy should appear as a
GET /metrics every --engine-scrape-interval (2s) and a
GET /v1/models every --health-interval (10s). Scrapes with no probes from
a proxy's node address means its prober has stopped. Nothing is logged when
that happens, because nothing failed: the sweep is still waiting.
Builds before Upstream::fetch bounded only a response's headers, so one
backend that sent headers and then stalled its body (a host rebooting
mid-response is enough) stopped the sweep for every backend, for good. With
the prober gone, a backend ejected by timeouts on every replica has nothing
left that can restore it. Restarting the proxies recovers immediately, since
a fresh registry starts every backend healthy. Upgrading removes the cause:
every background loop now reads the whole response under one deadline.
Two nodes serving the same model behave differently
Check they are running the same engine build. A load-balanced pool whose members differ is a pool that fails intermittently and blames the router — pin by digest, not by a floating tag.
Embeddings work but their tokens are not counted
Fixed. Any non-streaming response larger than the 8 KiB tail buffer used to lose its usage, which for a 22 KB embeddings response was every one of them. If you see it on an older build, that is the cause.
Running it
Install, the shapes, configuration, and what the process tells you once it is running.
In this section
| Deployment shapes | A binary, Docker, Compose with the planes split, Kubernetes split, and Kubernetes scaled out |
| Roles and configuration | The three roles, migrating off a config file, per-key RBAC in File mode, tuning affinity |
| Logs, metrics and traces | Log formats, the metrics worth alerting on, shutdown, per-replica views, webhooks and OTLP |
| Usage records and prices | usage_events, retention and roll-up, and keeping prices current |
Deployment shapes
Five, in the order deployments actually grow through them. Each is a complete, working configuration — pick the one that matches where you are.
Choosing a shape
Five, in the order deployments actually grow through them. Each is a complete, working configuration — pick the row that matches where you are.
| Planes | Good for | |
|---|---|---|
| 1. A binary | one process | a laptop, a single box, a VM |
| 2. Docker | one process | the same, without a toolchain |
| 3. Compose, split | two containers | one host, admin API off the public port |
| 4. Kubernetes, split | two Deployments | a cluster, one gateway replica per node |
| 5. Kubernetes, scaled out | control + N proxies | production traffic — manifests, Helm chart, or the operator |
The dividing line between the first two and the rest is --role. One binary
runs in three shapes, and everything below is that one flag plus what each
shape needs to reach its neighbours.
1. A binary
flowchart LR
    c([clients]) --> A["<b>--role all</b><br/>:4000 gateway<br/>:4001 admin + UI"] --> db[(Postgres)]
cargo build --release # target/release/fastllm-proxy
Or take a release binary and skip the toolchain. Then, against a Postgres you already have:
# Keep this key. It is not regenerable — see below.
export FASTLLM_ENCRYPTION_KEY=$(openssl rand -hex 32)
export FASTLLM_DATABASE_URL=postgres://fastllm@localhost/fastllm

fastllm-proxy --role all --host 0.0.0.0
# gateway on :4000, admin API and UI on :4001
--role all is control plane and gateway in one process, sharing state
directly — no HTTP round trip between them, and nothing to configure between
them either. Migrations apply at startup.
Then give yourself a login and a key:
fastllm-proxy set-password --name you --password 'change-me'
Three things about this shape worth knowing before you rely on it:
FASTLLM_ENCRYPTION_KEYis not regenerable. It encryptsproviders.upstream_api_keyat rest. Lose it and the upstream credentials in that database are gone; change it and the process will not start. Put it wherever you keep secrets before you put anything in the database.--hostdefaults to loopback. Binding0.0.0.0is a deliberate act, which is why it is not the default.- :4001 is not a public port. It serves the admin API, the UI and
/snapshot— and/snapshotreturns decrypted upstream credentials to anything holding the proxy token. On one box, leave it on loopback and reach it over SSH.
There is also a File mode — --role proxy --config config.yaml, no
database — that predates the control plane and still works unchanged, so a
deployment upgrading to this binary does not break. It is compatibility, not a
recommendation: nothing is persisted, there is no UI, no usage accounting and
no audit log. Every shape below assumes the database, and
import
is how a File-mode deployment moves onto one.
2. Docker
Same shape, no toolchain, from the public image:
docker run -d --name fastllm \
  -p 4000:4000 -p 127.0.0.1:4001:4001 \
  -e FASTLLM_ROLE=all \
  -e FASTLLM_DATABASE_URL=postgres://fastllm@db/fastllm \
  -e FASTLLM_ENCRYPTION_KEY=$(openssl rand -hex 32) \
  ghcr.io/azrtydxb/fastllm-proxy:v0.3.3
Note the asymmetry in the port mappings: :4000 is published, :4001 is
published to loopback only. That is the same rule as above, expressed in the
place people actually configure it.
With Postgres alongside it, the repo's root docker-compose.yml is the whole
thing in one command:
docker compose up -d
# proxy :4000, admin :4001, postgres :5432
docker compose exec fastllm fastllm-proxy set-password --name you --password 'change-me'
The image already sets FASTLLM_HOST=0.0.0.0 — a container nobody can reach
is not useful — which is why it is absent above and deliberate in shape 1. It
also bakes both classifier models in and points FASTLLM_CLASSIFIER_MODEL at
them, so semantic routing works here out of the box; a
hand-built binary needs --features classifier and a --classifier-model.
3. Compose, with the planes split
flowchart LR
    c([clients]) --> P["<b>--role proxy</b><br/>:4000 published<br/>holds a token and a snapshot"]
    P -. "snapshot poll" .-> K["<b>--role control</b><br/>:4001 on loopback<br/>holds the database credentials"]
    K --> db[(Postgres)]
deploy/docker-compose.split.yml runs the control plane and the gateway as
separate containers:
docker compose -f deploy/docker-compose.split.yml up -d
Three services: Postgres, --role control (database, admin API, UI,
/snapshot, no proxy listener), and --role proxy pointed at it with
FASTLLM_CONTROL_URL. They authenticate to each other with
FASTLLM_PROXY_TOKEN, which both must be given the same value of.
What the split buys, on one host, is that the admin API is no longer in the process serving public traffic. The gateway container has no database credentials, no encryption key, and no admin surface — it has a snapshot and a token. If the thing on the public port is the thing you worry about, this is the shape that shrinks it.
What it costs is a moving part: the gateway now depends on something to start
against. It degrades rather than fails — a proxy that cannot reach its control
plane falls back to the last snapshot it wrote to --snapshot-cache
(/var/lib/fastllm/snapshot.json, a volume in that file) rather than refusing
to start. That volume is the whole point of the fallback. Without it, a
gateway that restarts during a control-plane outage comes up with nothing to
serve.
This shape runs one gateway. Scaling past one wants something to balance across replicas and a separate snapshot cache per replica — which is where Compose stops being the right tool.
4. Kubernetes, with the planes split
flowchart LR
    c([clients]) --> LB{{"Service<br/>LoadBalancer"}}
    LB --> P1["proxy"]
    LB --> P2["proxy"]
    P1 -. " " .-> K["control × 1<br/>ClusterIP :4001"]
    P2 -. "snapshot poll" .-> K
    K --> db[("CloudNativePG")]
deploy/ holds the manifests for one real cluster, and they are worth reading
before the chart because they are concrete:
kubectl apply -f deploy/control.yaml      # Postgres + --role control
kubectl apply -f deploy/configmap.yaml    # the proxy's tuning knobs
kubectl apply -f deploy/deployment.yaml   # --role proxy, 2 replicas
kubectl apply -f deploy/service.yaml      # the gateway's LoadBalancer
Two Deployments, and the shape of each follows from what it does:
fastllm-control | fastllm-proxy | |
|---|---|---|
| Replicas | 1 | 2+, spread across nodes |
| Holds | database URL, encryption key, proxy token | proxy token, control URL |
| Serves | :4001 admin | :4000 gateway |
| Service | ClusterIP by default | LoadBalancer |
| Storage | the Postgres cluster | an emptyDir snapshot cache |
The control plane is one replica deliberately: it is not on the request path, and a second would race the first rebuilding snapshots for no gain.
The gateway is two, on different nodes, because a gateway that dies with one node is not a gateway. Prefix affinity is per process, so two replicas mean a prefix can be cached on two nodes rather than one — the cost of the redundancy, and it is small.
The control plane's Service is ClusterIP because of /snapshot again. The
manifests in deploy/ do give it a LoadBalancer on a pinned VIP, with TLS
from a Certificate and a comment saying exactly what that decision rests on:
a session-authenticated admin API, TLS, and a private network. Take away any
one of those three and it should go back to ClusterIP.
5. Kubernetes, scaled out
Three ways to express the same two Deployments. The first two differ in how they are written; the third differs in what happens after the write.
| Manifests | kubectl apply -k deploy/kubernetes/base/. Read exactly what is applied, and edit it. Overlays for TLS and a LoadBalancer |
| Helm chart | Values rather than patches, and templating across many environments |
| Operator | A FastllmProxy resource, reconciled continuously |
# Manifests
kubectl apply -k deploy/kubernetes/base/

# Helm
helm install fastllm charts/fastllm-proxy \
  --set proxy.replicas=6 \
  --set database.existingSecret=fastllm-pg-app \
  --set secrets.existingSecret=fastllm-secrets

# Operator
kubectl apply -f operator/deploy/crd.yaml
kubectl apply -f operator/deploy/operator.yaml -f operator/deploy/rbac.yaml
kubectl apply -f operator/deploy/example.yaml
What the operator adds is not templating — a chart describes the deployment once, at apply time, and four things it cannot describe are the reason to run a controller:
| Upgrades are ordered | The two planes share a database schema. spec.image rolls the control plane first, and the gateway is held at the image it is running until that has finished. An image that cannot be pulled therefore takes the control plane down and leaves the gateway serving |
| A rotated Secret rolls the pods that read it | secretKeyRef env is resolved once, at container start. The pod templates carry a hash of the resolved material, so rotating the proxy token — or cert-manager renewing the control-plane certificate — is a rollout instead of a change that quietly does nothing |
| A bad configuration is refused, not deployed | Every referenced Secret is resolved and checked before anything is applied. A missing key or a 31-byte encryption key becomes a condition naming the Secret and the key, rather than pods in CreateContainerConfigError |
| The install finishes | bootstrap runs set-password as a Job once the control plane is ready, so the deployment ends with a UI somebody can log into rather than one nobody can |
$ kubectl -n fastllm get fllm
NAME      PHASE   GATEWAY   CONTROL   IMAGE                                   AGE
fastllm   Ready   3/3       true      ghcr.io/azrtydxb/fastllm-proxy:v0.3.3   2m
IMAGE is what is actually serving, not what was asked for — during an
upgrade it lags spec.image, which is the point of printing it.
Scaling means scaling proxy, by replicas or by autoscaling (an HPA on
CPU; the controller then stops writing the replica count so the two do not
fight). The control plane stays at one — it does not see request traffic, and
nothing about serving more requests asks for more of it, so no install path
exposes a replica count for it.
What changes as the data plane grows:
| Prefix affinity dilutes | Affinity is per process, so N replicas can hold N copies of a prefix. Fewer, larger replicas cache better than many small ones — the opposite of the usual instinct |
| Health is per replica | Each reports its own view. The Fleet screen never merges them: one replica seeing a backend down while others do not is a partition, and averaging deletes the only symptom |
| Rate limits are per replica | Counters are in memory, reconciled against the database periodically. A 60/min limit across 6 replicas is approximately 60/min, not exactly. Budgets, which are cumulative, do not have this property |
| Snapshot versions can differ | A replica on an older snapshot answers /health with ok and misbehaves only on whatever changed — usually a key it has never seen. The Fleet screen's version column is where that shows. Expect spread after every change: poll and report are separate timers. Judge it by how long the newest snapshot has been published, not by the gap between version numbers — versions are stamped when the content last changed, so the gap measures edit history rather than staleness |
For the request path itself, --workers and --pool-max-idle are the knobs
that matter, and the performance chapter has the
measurements rather than the intuitions.
Roles and configuration
What each --role does, how a File-mode deployment moves onto a database,
and the config file's tuning knobs.
Roles
One binary, three ways to run it, via --role (FASTLLM_ROLE):
| Role | What it does | Needs |
|---|---|---|
proxy (default) | Forwarding only, against either a control plane (Http mode) or a config file (File mode) | --control-url + --proxy-token (Http mode), or --config alone (File mode) |
all | Control plane and forwarding in one process, sharing state directly — no HTTP round trip between them | --database-url, FASTLLM_ENCRYPTION_KEY |
control | Database, admin API (/admin/* — keys, principals, roles, models, backends), /snapshot and /usage — no proxy listener | --database-url, FASTLLM_ENCRYPTION_KEY |
proxy is the default deliberately, not all: it is the only role that asks for nothing beyond what a pre-control-plane deployment already passed (--config and nothing else), so an existing deployment upgrades to this binary without gaining a new required flag. all and control are explicit opt-ins via --role/FASTLLM_ROLE.
Http mode degrades gracefully: a proxy that cannot reach its control plane at startup, or loses it later, falls back to the last snapshot it wrote to --snapshot-cache (default /var/lib/fastllm/snapshot.json) rather than refusing to start or dropping traffic.
Migrating a File-mode deployment onto a database
fastllm-proxy import --config litellm_config.yaml --database-url postgres://...
Idempotent — seeds providers/provider_models and the auth: block (a service_account principal per key, the key itself as a SHA-256 hash, and its model grants) from a LiteLLM-format config, and can be run more than once safely.
Everything a backend row can hold is carried across, not just the address:
| from the file | into providers/provider_models |
|---|---|
api_base | the address, trailing slash trimmed |
model | upstream_model. A transport prefix (openai/, vllm/, openrouter/) is stripped; a wire-format prefix (anthropic/, gemini/) only when the backend speaks that protocol, so an OpenRouter id like anthropic/claude-sonnet-4 survives intact |
api_key | upstream_api_key, AES-256-GCM encrypted before it reaches Postgres. LiteLLM's not-needed/none placeholders are treated as absent |
protocol | openai (default), anthropic or gemini |
auth_header | defaults to authorization; Azure OpenAI wants api-key |
auth_scheme | defaults to Bearer; "" stores as NULL and sends the key raw |
default_max_tokens | required in practice by an Anthropic backend |
Two entries sharing a model_name become one model with two backends — a
load-balanced pool.
The auth: block carries its enforcement, not only its identity:
| from the file | into the database |
|---|---|
key | api_keys.hash (SHA-256) plus a display prefix. Never stored in plaintext, never printed back |
name | a service_account principal, and a role import:<name> holding just that key's grants |
provider_models | one model:invoke grant per model; ['*'] becomes allow-all |
expires_at | the key's expiry |
limits | the limits row — requests_per_min, tokens_per_min |
budget | the budgets row, as a monthly window, because the file format has no window to carry |
budget.tokens_used is written when the row is created and never on a
re-import. Once a budget is in the database it advances from real usage, and
letting a static number in a config file rewind it would hand back spend that
was already consumed.
Re-importing an edited file converges. A backend is keyed on
(model, api_base, upstream_model): a row that already exists is updated
rather than duplicated, so a protocol: corrected in the file reaches the
database. The one exception is the credential, which is written only when the
file names one — a file with no api_key usually means the credential was set
through the admin API afterwards, and overwriting it with nothing on the next
import would revoke a working backend for no reason. Point --role=all/control at the same database afterward and the same keys keep working, with the same per-model authorisation they had in File mode.
Each imported key gets its own role, import:<name>, holding just that key's grants — models: ['*'] becomes model:invoke on model/* (i.e. allow-all), a named list becomes one grant per model. Re-importing an edited file converges: grants dropped from the file are revoked, not merely left behind. import never prints a key back; the config file is the only copy of the plaintext.
Day-to-day changes after the initial seed go through the admin API below rather than another import run or hand-written SQL, so they reach a running control plane immediately instead of on its next periodic rebuild.
First key, by API
Principal 1 is the bootstrap service account the migrations seed, already
holding the inference role. For anything beyond a first key, create your own:
# A principal, then a role for it, then a key against it.
curl -XPOST localhost:4001/admin/principals -H 'content-type: application/json' \
  -d '{"name":"ci-pipeline"}'                       # -> {"id":2,...}
curl -XPOST localhost:4001/admin/principals/2/roles -H 'content-type: application/json' \
  -d '{"role":"inference"}'
curl -XPOST localhost:4001/admin/keys -H 'content-type: application/json' \
  -d '{"name":"ci","principal_id":2,"expires_at":"2027-01-01T00:00:00Z"}'
(import, run on the host rather than inside the container, needs the same
FASTLLM_ENCRYPTION_KEY the control plane was given — they share one
database, so they must agree on one key.)
Configuration
The schema is a superset of the LiteLLM proxy config, so a file generated by sparkrun proxy start works as-is:
model_list:
  # Two entries sharing a model_name become one load-balanced pool.
  - model_name: Qwen/Qwen3-1.7B
    litellm_params:
      model: openai/Qwen/Qwen3-1.7B
      api_base: http://10.24.11.13:8000/v1
      api_key: not-needed
  - model_name: Qwen/Qwen3-1.7B
    litellm_params:
      model: openai/Qwen/Qwen3-1.7B
      api_base: http://10.24.11.14:8000/v1

  # An alias: clients say "gpt-4", the upstream is sent its real name.
  - model_name: gpt-4
    litellm_params:
      model: openai/Qwen/Qwen3-1.7B
      api_base: http://10.24.11.13:8000/v1

general_settings:
  master_key: sk-...

# Optional, ignored by LiteLLM so one file can drive either.
fastllm:
  prefix_bytes: 2048 # bytes of the raw body hashed for the affinity key
  balance_abs: 8 # absolute in-flight slack before affinity yields
  balance_rel: 1.5 # relative slack multiplier
  affinity_slots: 65536 # prefix-affinity cache entries
  unhealthy_after: 2 # consecutive failed probes before eviction
  consecutive_timeout_threshold: 2 # consecutive header timeouts before eviction
openai/, vllm/, hosted_vllm/ and openai_like/ prefixes are stripped from litellm_params.model; a name that is genuinely Qwen/Qwen3-1.7B keeps its org. not-needed, none and null API keys are treated as absent.
Per-key RBAC in File mode
--master-key/general_settings.master_key is one shared secret for every client and is deprecated. The replacement in File mode (no --control-url) is an auth: block:
auth:
  keys:
    - key: sk-...
      name: ci-pipeline
      models:
        ["qwen3-6-35b-a3b-nvfp4"] # `["*"]` for every model; an empty
        # or omitted list grants nothing
      expires_at: "2027-01-01T00:00:00Z" # RFC 3339, optional
      limits: # optional; absent means unlimited
        requests_per_min: 60
        tokens_per_min: 100000
      budget: # optional; absent means unlimited
        tokens_total: 1000000
        tokens_used:
          0 # optional starting point; static —
          # File mode has no reconciliation
          # loop to advance it on its own
Absent auth: means open (no key required) — today's behaviour when no master key is set either. In Http mode (--control-url given), auth: is ignored: keys live in the database and are managed through the control plane's admin API instead. fastllm-proxy import carries an existing auth: block into that database unchanged (see "Migrating a File-mode deployment" above), so the same keys authorise the same models on either side of the move. limits is File mode's mirror of the control plane's limits table (see "Rate limits" above) — either field alone, both, or neither. budget is the same mirror of the budgets table (see "P3: usage accounting and budgets" above).
Protecting an engine from its own queue
vLLM accepts every request and queues the surplus itself, unbounded. A burst does not fail -- it makes every request slow, including the ones already running, until first-byte latency crosses the upstream timeout and the timeout path ejects a backend that was working. Flow control moves that queue into the proxy, where it is bounded and a caller can be told "not now" at once.
It is set per backend, on the Models page (the FLOW CONTROL cell of each
backend row) or with PATCH /admin/backends/{id} -- never in a config file,
because the right numbers are a property of the engine, and changing them must
not need a redeploy. File mode has no gates.
| Field | Default | Meaning |
|---|---|---|
admission_max_concurrent | off (null) | Most concurrent requests each proxy replica sends the engine. Setting it turns the gate on; null turns it off. |
admission_high_water | 4 | Engine queue depth (vllm:num_requests_waiting) at which the ceiling halves. |
admission_max_queued | 64 | Requests allowed to wait at the proxy; beyond it they get 503. |
admission_max_wait_seconds | 30 | How long a request waits for a slot before 503. |
upstream_timeout_seconds | --upstream-timeout | Time to first byte before the request fails. Edited in the same dialog because it is the other half of the same problem. |
The engine scraper (--engine-scrape-interval, default 2s) halves the gate's
ceiling while the engine reports high_water or more requests waiting, and
raises it by one per scrape once that queue has drained to zero. Requests past
the ceiling wait at the proxy, up to max_queued of them for up to
max_wait_seconds; beyond that they get 503 with Retry-After and
"type": "backend_overloaded". That is deliberately not 429: it is a statement
about the backend, not the caller's quota. Changes reach running proxies on
their next snapshot poll.
- A pool still balances. A request that finds its engine's gate full moves to an untried sibling without waiting, and only queues when there is nowhere else to go.
- Each replica has its own ceiling, so N proxies admit up to N times
admission_max_concurrentbetween them. The engine's queue depth reflects all of their traffic, so each backs off on what the others sent too. - Running requests are never cut off. A lowered ceiling takes effect as slots come free.
- An engine with no
/metricskeeps a fixed ceiling atadmission_max_concurrent-- still a concurrency cap, just not an adaptive one.
Start with admission_high_water at a few requests -- a small queue is an
engine keeping its GPU busy, not one falling behind -- and
admission_max_concurrent at roughly the engine's --max-num-seqs divided by
the number of proxy replicas.
Seeing it work. The Fleet page shows, per backend, the engine's own
running/waiting counts and the gate's slots in use over its current ceiling
(amber while it is holding traffic back); hover for admitted and refused totals.
The Models page shows the same in each backend's FLOW CONTROL cell. For
dashboards, /metrics carries:
| Series | Type | Meaning |
|---|---|---|
fastllm_backend_engine_requests{state="running"|"waiting"} | gauge | What the engine itself reports, when fresh. |
fastllm_admission_max_concurrent | gauge | The configured ceiling. |
fastllm_admission_capacity | gauge | The current ceiling; below the configured one while the engine is behind. |
fastllm_admission_in_use | gauge | Slots held by requests in progress. |
fastllm_admission_queued | gauge | Requests waiting at the gate. |
fastllm_admission_admitted_total | counter | Requests let through. |
fastllm_admission_refused_total{reason="full"|"timed_out"} | counter | Refused at once (queue full, or moved to a sibling) or after waiting. |
All are labelled api_base and model, per replica; sum across replicas for
the fleet.
Tuning affinity
balance_abs / balance_rel set how much imbalance is tolerated before cache locality is given up. Higher values favour cache hits; lower values favour even load. The default (8 requests absolute, 1.5× relative) suits a small cluster of a few nodes with long shared system prompts. If your traffic has little prefix sharing, --policy least-loaded is the honest choice and skips the bookkeeping.
--policy lowest-latency is for a pool whose members are not equivalent — a fast GPU beside a slower one, or a local node beside a hosted provider. Least-loaded is misled there: a slow backend with one request queued looks emptier than a fast one with two, so it keeps being fed. This ranks by an exponentially weighted mean of recent whole-request latency instead, tie-broken by in-flight so equally fast backends still balance.
Three properties worth knowing before choosing it:
- A backend with no completed requests is eligible, not fastest. Treating an unmeasured backend as 0 µs would hand it the whole pool before it proved anything; excluding it would mean a newly added backend never got a request and so never earned an estimate.
- Backends within 12.5% of the best are treated as equal. Without that band the pool oscillates — whichever backend last finished quickest wins every subsequent pick until its own queue slows it down.
- It is cache-blind. On matched nodes serving long shared prefixes,
cache-affinitywins: a prefix cache hit is worth far more than a few hundred microseconds of measured difference between identical machines. That is why the default did not change.
Logs, metrics and traces
What this process tells you about itself, and which of it is worth an alert.
Logs
--log-format text (the default) is human-readable; --log-format json
(FASTLLM_LOG_FORMAT=json) emits one JSON object per line with the event's
fields at the top level rather than nested, which is what a collector indexes
without a transform step:
{
  "timestamp": "2026-08-08T08:29:54.896902Z",
  "level": "INFO",
  "message": "starting",
  "models": 1,
  "backends": 1,
  "policy": "CacheAffinity",
  "role": "Proxy"
}
--log (FASTLLM_LOG) takes an EnvFilter directive, so
--log 'info,fastllm_proxy::proxy=debug' turns on per-request routing and
classification detail without the rest.
Metrics worth knowing about
Most are self-describing from their # HELP text. Five are not obvious:
-
fastllm_classify_escalations_totalis notfastllm_classified_refined_total. The second counts prompts the transformer decided; the first counts prompts it was asked about. When it declines, the fast tier's answer stands and is counted asclassified_fast. The gap between them is how often the expensive tier ran and changed nothing, and the escalation rate itself is the number the two-tier design is justified on. -
fastllm_backend_duration_secondsversusfastllm_model_duration_seconds. A model's p99 rising says the model got slow. The per-backend one says which replica did, which is the difference between "the provider is degraded" and "one of our two GPUs is". -
Per-backend series are keyed by
api_baseandmodel.api_basealone does not name a backend — every OpenRouter model shareshttps://openrouter.ai/api/v1— sofastllm_backend_healthy,…_requests_total,…_errors_totaland…_duration_secondsused to repeat one series per backend and Prometheus kept only the first (PrometheusDuplicateTimestamps). Aggregate overmodelto get a whole host:sum by (api_base) (rate(fastllm_backend_requests_total[5m])). -
fastllm_upstream_status_totalkeeps 429 separate from other 4xx. It is the retryable one, and the reason a pool that passes every health check can still refuse a request — lumping it with client errors hides the signal that explains a failover. -
fastllm_snapshot_age_secondscompares two machines' clocks, since the stamp is the control plane's. It is clamped at zero rather than going negative on skew, which would read as a broken exporter. -
fastllm_cache_total{kind="hit"|"miss"|"store"}counts three things, not two. A miss that is never stored is a response the cache declined to keep — streaming, an error, too large — sostorewell belowmissis the cache working as intended on uncacheable traffic, not a bug.fastllm_cache_entriesandfastllm_cache_bytesare the live occupancy against the configured bounds.
fastllm_build_info is a constant 1 carrying the version as a label — the
conventional shape, and what turns "latency moved at 14:02" into "latency moved
when we shipped this".
Shutdown
On SIGTERM (or Ctrl-C) the proxy stops accepting connections, tells every open
one to stop keep-alive, and waits for in-flight requests to finish before
exiting — --shutdown-grace (FASTLLM_SHUTDOWN_GRACE, 25s) bounds the wait,
sitting under Kubernetes' 30s terminationGracePeriodSeconds.
This matters for a streaming gateway specifically: a generation can run for
minutes, and cutting it produces a response that stops mid-sentence with no
error for the client to retry on. Measured against a 6-second stream with the
signal sent 2 seconds in: at the default the client received every frame
including [DONE]; at --shutdown-grace 0 it received two frames and nothing
else.
If the grace expires with connections still open, they are closed and the count is logged at WARN — those are requests somebody is still waiting on, and silence would make the truncation look like a client bug.
What each replica can see
GET /admin/fleet on the control plane reports, per proxy replica, its
backends' health and in-flight counts and the snapshot version it is serving.
Proxies push this every --health-report-interval (default 10s) over the same
--proxy-token channel as usage.
Two questions it answers that /metrics cannot without scraping every pod:
whether the fleet agrees a backend is up — a single replica that disagrees is a
network partition, not a dead backend — and whether every replica is on the
same snapshot version, which is how a pod stuck on an old configuration becomes
visible.
Nothing is stored: a replica that stops reporting ages out after 30 seconds. "Up, 40 minutes ago" is not health.
Notifications
Everything this gateway knows is already published — /metrics to scrape,
/admin/fleet to poll, usage_events to query. All of it requires somebody
to be looking. --webhook-url is the other direction, for the conditions
worth telling someone about at 3am:
| event | when |
|---|---|
backend_down | a replica newly reports a backend unhealthy |
backend_recovered | the same backend reporting healthy again |
snapshot_rebuild_failed | a rebuild failed after a write committed, so the database and the published snapshot have diverged |
Transitions, not states. A backend that is down stays down, and a health report every ten seconds would otherwise become six alerts a minute for one incident. A replica's first report emits nothing at all — there is no previous state to have changed from, and a control-plane restart would otherwise announce every already-down backend as though it had just failed.
Per replica, not merged. Every replica losing a backend is a dead
backend; one replica losing it is a partition. Merging them here would delete
the distinction before anyone saw it, which is the same reason
GET /admin/fleet never averages replicas together.
--webhook-secret signs each body with HMAC-SHA256 in x-fastllm-signature,
in the sha256=<hex> form most receivers already know. A webhook endpoint is
reachable by anyone who learns its address, so a receiver that acts on
notifications wants to know where they came from.
Delivery is one attempt with a five-second timeout and no retry, from a small
bounded queue. A receiver that is down will still be down in five seconds,
and a retry loop would turn one unreachable endpoint into a queue that never
drains — while the condition being reported is still true and still visible
on /metrics and /admin/fleet. Notifications dropped because the queue was
full are counted rather than silently discarded.
Traces
Built only with --features otel, because it is the one part of telemetry that
adds a dependency tree (opentelemetry plus tonic/gRPC) and the only one needing
something deployed to receive it. A build without the feature carries none of
it and pays nothing at runtime — the instrumentation compiles away.
--otel-endpoint http://collector:4317   # unset disables tracing
--otel-sample-one-in 100                # 1 traces everything
--otel-service-name fastllm-proxy
One span per request, chat_completion, carrying the requested model, the
model that actually served it, the backend, whether it streamed, the prompt
class if one matched, the upstream status, and how many attempts it took. That
last pair is the reason to reach for a trace rather than a metric: a histogram
says the 99th percentile moved, a span says this request failed over twice
and landed on the fallback.
Deliberately not recorded as span attributes: the request body, the caller's principal, or any credential. A tracing backend is a log with a nicer UI, and prompts do not belong in one.
Two behaviours worth knowing:
- Sampling is by counting, not randomly. One request in
nexactly, rather than a ratio that is only right on average — at low volume a random sampler means a quiet hour traces nothing. An upstream sampling decision is honoured before this one, so the proxy never punches a hole in the middle of somebody else's trace. - An unreachable collector is not an outage. If the exporter cannot be built at startup the proxy logs it and serves traffic untraced; export itself is a background batch task, so a collector that goes away costs dropped spans rather than dropped requests.
Usage records and prices
The per-request row behind every spend figure, how long it is kept, and where prices come from.
Per-request records
usage_events carries latency and outcome alongside the token counts:
duration_ms, ttft_ms, status, and requested_model when the client asked
for a name that differs from the one that served it — a frontend model, or the
head of a chain that failed over.
One row per request that reached a backend, whether or not the response
carried token counts. usage_reported says which: false means the counts are
unknown, not zero, and such a row has cost_micros NULL rather than 0. Any
query that sums tokens or spend should filter on it — WHERE usage_reported —
while any query counting requests must not, since the rows it would exclude
are disproportionately the ones that failed.
Refusals are recorded too, and refusal says which kind. It is NULL for
every row describing a response a backend actually returned, and set for the
four cases the gateway decides itself:
refusal | status | meaning |
|---|---|---|
authorisation | 403 | authenticated, but not granted the model |
rate_limit | 429 | over a configured per-minute limit |
budget | 402 | budget window exhausted |
no_backend | 502 | nothing in the chain could be reached |
no_backend is why the column exists. A refused request has no forwarded
response body, and the body is what writes the row — so before this, a total
backend outage produced no rows at all and an error rate computed here read
a flat zero at exactly the moment nothing worked.
Keep the two apart when charting. refusal IS NULL AND status >= 400 is
"errors an upstream returned"; refusal IS NOT NULL is "requests the gateway
turned away". Blending them into one error rate tells an operator to do
neither of the two available things — raise a budget, or go and look at a GPU
node.
Retention
usage_events takes one row per request now, so it has a policy rather than
needing watching: raw rows for 90 days, hourly rollups beyond that, kept
indefinitely. An hourly task folds everything past the cutoff into
usage_rollup_hourly and deletes the rows it summarised — in one
transaction, because doing the two separately would lose any request written
between the summary and the delete.
/admin/timeseries reads both tables and unions them, so a chart does not
end at the retention boundary. What changes across it is granularity, and one
thing more:
Rolled-up buckets report no latency at all. Percentiles do not merge —
averaging two hours' p95 produces a number that is the p95 of nothing — so
the rollup stores duration_ms_sum and duration_ms_count and the API
returns null for p50/p95 over rolled-up data. The chart breaks its line
there, the same as for an empty bucket, rather than drawing a continuous
line whose meaning silently changed 90 days back. A mean is recoverable from
the two stored columns by anyone who wants one.
To keep raw rows longer, change RAW_RETENTION_DAYS in src/control/api.rs;
the roll-up is additive (ON CONFLICT DO UPDATE), so a longer window simply
folds later.
Refusals with nobody to attribute them — a 401 from an invalid key, a 404
for a model that does not exist — are in gateway_rejections instead, and
/admin/timeseries reports them as refused_unattributed. So a
caller-visible error total is answerable from Postgres alone; it is simply
two tables, because the two kinds of failure are shaped differently.
They are counts bucketed to the minute per replica, not rows per request, and that is deliberate: 401 is the one refusal an anonymous stranger can trigger at will, so a row apiece would let unauthenticated traffic drive unbounded writes. The counters ride the health report the proxies already send every ten seconds; the control plane holds each replica's previous report, so it stores the delta. A counter that went down means that replica restarted, and the new value is taken as the delta rather than producing a negative. A replica's first report is skipped rather than counted from zero — its counter covers however long that process has been alive, and charging all of it to the current minute would draw a spike that never happened.
These rows carry no model and no principal, so they are excluded whenever you filter by either. A filtered view that included them would attribute anonymous failures to whichever model or caller you happened to be looking at.
This is where per-caller detail lives, and deliberately not in Prometheus: the answer to "which callers got slow" is per principal and per key, and a label with that cardinality is how a metrics endpoint becomes an outage. Here it is a column in a database, already batched off the request path.
SELECT p.name, count(*), percentile_cont(0.95)
         WITHIN GROUP (ORDER BY u.ttft_ms) AS p95_ttft_ms
FROM usage_events u JOIN principals p ON p.id = u.principal_id
WHERE u.at > now() - interval '1 hour' AND u.ttft_ms IS NOT NULL
GROUP BY p.name ORDER BY p95_ttft_ms DESC;
Every new column is nullable, and that is load bearing. ttft_ms is NULL for a
non-streaming response, where it would be a copy of duration_ms rather than a
second measurement; all four are NULL on a row written by a proxy that predates
them. A zero would be indistinguishable from a request that answered instantly.
One limit worth knowing: a usage row exists only for principals whose consumption is tracked — those with a budget or a token rate limit — because nothing else parses the response body. Per-model metrics cover every request; per-caller rows cover those.
Keeping prices current
fastllm-proxy sync-prices --database-url "$URL" fills in any model whose
price is unset, from OpenRouter's published list and the community catalogue.
--dry-run first; the next snapshot rebuild picks the change up, with no
restart.
Worth running on a schedule, and worth knowing what it is not: where a
provider reports what it actually charged — OpenRouter returns usage.cost
unasked — that figure is used instead and this table is never consulted. The
sync matters for providers that publish a price but do not report one per
request.
Registering hosts that serve models
A host that serves models can tell FastLLM so, and keep telling it. When it stops, its providers stop being routed to — and eventually stop existing.
This exists because the registry drifts. Two real cases, both found by hand: a provider model pointing at a host that had been swapped to serve something else entirely, and a model with no provider at all. The first is the interesting one: the host was healthy and answering. No liveness check can catch that, because nothing was down.
What the agent does
It registers an address, on a lease, and refreshes it. That is all.
It deliberately does not send a model list. FastLLM has to reach the endpoint
anyway in order to serve traffic, so the control plane calls GET /v1/models
itself: a list pushed from the host could name models the proxies cannot dial,
and that failure would surface at request time, to a user. Enumerating from the
control plane makes discovery and reachability the same test.
It dials the control plane and is never dialled, so it works from a host behind NAT, or on a cluster FastLLM cannot reach into.
Running it
FASTLLM_CONTROL_URL=https://control.example:4001 \
FASTLLM_AGENT_TOKEN=sk-... \
python3 agent/fastllm-node-agent.py \
  --advertise 192.168.10.246 \
  --scan-ports 8000 8001 8890 \
  --engine vllm
Standard library only, so there is nothing to install. That is deliberate: this runs on machines whose Python is whatever the vendor shipped, and a health agent that needs a virtualenv to start is one more thing to be broken at 3am.
| Flag | Why it matters |
|---|---|
--advertise | The address proxies will dial. Configured, never inferred — an agent that discovers a container on 172.17.0.2 and registers that hands the proxies an address they cannot reach. |
--scan-ports | Ports to probe on that address. Catches a bare process started by hand or by a launcher, with no container runtime present. |
--api-base | Register an endpoint outright, repeatable. Use when the address is not a port on --advertise. |
--ttl / --interval | Lease length and heartbeat. The agent refuses an interval that is not well inside the TTL, since one slow beat would then expire the lease. |
--discover-interval | How often to look for endpoints again (60s). Separate from --interval on purpose: leases on what is already known are renewed on their own clock, so a slow discovery pass never lets one lapse. |
--probe-workers | Candidates probed at once during discovery (32). A cluster exposes hundreds of ports that are not models; probed one at a time, a pass on kw took over a quarter of an hour. |
--provider-name | What this host's providers are called in FastLLM (the first part of <host>-<model>-<port>). The model and port are appended, so one host's endpoints stay distinguishable — always, not only when a second one appears, since a name that changed shape as a model was started would rename the first one behind you. Defaults to --node, and is sent on every heartbeat, so changing it renames them. |
--engine | A hint, carried as metadata. Nothing depends on it. |
--token | A principal API key. It authenticates the agent; there is no permission to grant beyond that. |
--ca-cert | PEM bundle to verify the control plane against, when its certificate comes from an internal CA. There is deliberately no way to skip verification — the token above goes over this connection, and an agent that stops checking hands it to whoever answers. Pass the CA's certificate, or a lone self-signed certificate, which is its own issuer. |
--once | Register and exit, for a cron or a smoke test. |
Running it in Kubernetes
agent/kubernetes.yaml runs the same agent with --kubernetes, where it asks
the API which addresses the cluster exposes instead of probing a list of ports.
A port probe is what you do on a host with no service registry; a cluster has
one, and guessing at ports when something can tell you is how an engine on a
port nobody thought of stays invisible.
Exposed is the whole criterion, which is why there is no label to apply and
no annotation to remember. A NodePort, a LoadBalancer and a hostPort are
reachable from outside the cluster by definition; a ClusterIP is not, and so is
never a candidate — not refused, simply not exposed, which is the answer the
operator already gave by choosing that type. Whether a candidate is a model is
then settled the same way it is for every other source: by asking it for
/v1/models. A cluster that exposes Postgres and an ingress and no engines
registers nothing.
Under --kubernetes, --scan-ports defaults to nothing. Pass it explicitly to
have both.
Host networking, and the port nobody declared
A pod on hostNetwork publishes on the node whether or not it declares a
containerPort, and one that declares none tells the API nothing about where
it listens. That is not hypothetical: this project's own engines are exactly
that — hostNetwork: true, no ports declared, serving on 8000 — and a scan
that only reads port fields finds nothing while the engine answers happily.
So for a host-network pod the agent takes, in order: a declared hostPort, then
a declared containerPort (under host networking that is a node port), then
the --port flag from the container's command, and failing all three, the
numeric port of an httpGet readiness, liveness or startup probe. The last two
read declarations the operator already wrote, which is what makes them not a
port scan — the audio servers on kw take their port from a config file, and
their readiness probe is the only place the pod spec names it. Still, they are
fallbacks. Declaring containerPort on a host-network pod is the better
fix, costs nothing, and makes the API describe the pod properly for everything
that reads it, not just this agent.
Every provider is named <cluster>-<node>-<model>-<port>: --node (the
cluster, since one agent speaks for all of it), the node the endpoint runs on,
the first model its /v1/models answers with, and the port — for example
kw-gx10-9c17-nvidia-qwen3.6-35b-a3b-nvfp4-8000 and
kw-gx10-48f4-bge-m3-8890. Each part is lowercased and anything outside
[a-z0-9.] becomes a dash. Together they stay distinct where any one part
repeats: several engines on one port, several models on one node, one model
on several nodes. A Service advertised through fastllm.io/advertise takes the
node from the pods its selector picks (all on one node, or no node part at
all); a part the agent cannot know is left out rather than guessed. The
annotation is only honoured for http:// and https:// addresses. On a bare
host --node already names the machine, so the name is
<host>-<model>-<port>. Names are sent on every heartbeat, so an upgraded
agent renames existing providers in place; routing follows model names, never
provider names.
What it needs
A ServiceAccount that can list services, pods and nodes, and nothing else —
it never writes to the cluster it runs in. Nodes because a host-network pod is
addressed by its own node's InternalIP, read from the Nodes API: a cluster runs
engines on several nodes, and one fixed address would register half of them
under the wrong host. A Deployment rather than a DaemonSet: the agent reads
cluster-wide state, so one copy answers for the cluster, where one per node
would have every node re-register the same LoadBalancer.
--advertise is optional here, and when set still means the address a
proxy will dial: for NodePorts, and as an override for a cluster whose
nodes are reached some other way than their InternalIP. It is not this pod's
address and not a ClusterIP — what is registered is a destination for someone
else's traffic, and the agent's own outbound reachability says nothing about
it.
The manifest runs the ghcr.io/azrtydxb/fastllm-node-agent image the release
build pushes on every v* tag, with the script baked in; its flags go in
args, because command would replace the image's entrypoint. It is written
for kw, where the control plane is in the same cluster and reached by its
service name, which its certificate carries. Two secrets come first:
# The control plane's CA, copied from its own TLS secret — a pod cannot
# mount a secret from another namespace.
kubectl create namespace fastllm-agent
kubectl -n fastllm get secret fastllm-control-tls -o jsonpath='{.data.ca\.crt}' \
  | base64 -d > ca.crt
kubectl -n fastllm-agent create secret generic fastllm-control-ca --from-file=ca.crt

# A key for a principal of the agent's own. Any principal's key authenticates
# a registration; a dedicated one is what scopes the agent to the providers it
# registered. The proxy token is not a principal key and is refused with 401.
curl -sk -b ck -X POST https://192.168.10.129:4001/admin/principals \
  -H 'content-type: application/json' -d '{"name":"node-agent-kw"}'
curl -sk -b ck -X POST https://192.168.10.129:4001/admin/keys \
  -H 'content-type: application/json' \
  -d '{"principal_id":"<id from above>","name":"node-agent-kw"}'
kubectl -n fastllm-agent create secret generic fastllm-agent-token \
  --from-literal=token=sk-...

kubectl apply -f agent/kubernetes.yaml
Working means a registered ... leased=True line for each engine within a
minute of the pod starting, and one every --interval after that.
Running it under systemd
agent/fastllm-node-agent.service is the unit for a host outside any cluster.
This project's DGX Sparks ran it until they joined kw; it is now disabled on
both, since the in-cluster agent registers their engines and two agents
registering one endpoint fight over its name. It expects the script at /usr/local/bin/fastllm-node-agent and its
configuration in /etc/fastllm/agent.env:
FASTLLM_CONTROL_URL=https://control:4001
FASTLLM_AGENT_TOKEN=fllm_...
FASTLLM_NODE=dgx-spark
FASTLLM_ADVERTISE=192.168.10.246
sudo useradd --system --no-create-home --shell /usr/sbin/nologin fastllm-agent
sudo install -m 0755 agent/fastllm-node-agent.py /usr/local/bin/fastllm-node-agent
sudo install -d -m 0755 /etc/fastllm
sudo install -m 0644 ca.crt /etc/fastllm/ca.crt
# The token is a live credential: the agent's user, and nobody else.
sudo install -m 0640 -o root -g fastllm-agent agent.env /etc/fastllm/agent.env
sudo install -m 0644 agent/fastllm-node-agent.service /etc/systemd/system/
sudo systemctl enable --now fastllm-node-agent
Restart=always, because a host that serves models is not a host that should
stop saying so over one failed registration. The unit has no After=docker:
the agent registers whatever is serving, container or bare process, and must
come up on a host with no container runtime at all.
The name lives on the agent
A dynamic provider is named by the host registering it, not by the control
plane, which only ever sees an address. dgx-spark-8000 is a better thing to
read on a screen than 192.168.10.246:8000, and the agent is what knows which
is which.
Renaming is therefore a matter of changing --provider-name and letting the
next heartbeat carry it. That is safe: routing resolves a target by its
model's name, so a provider's name is descriptive. Nothing else refers to a
provider by name — a target names a model, and which providers serve it is the
model's business — so a rename leaves nothing dangling.
A name another provider already holds is declined — with a warning in the control plane's log — and the heartbeat still succeeds. A collision is not a reason to let a lease lapse, and an operator seeing the old name is visible and recoverable in a way that a host which quietly stopped renewing is not.
Static and cloud providers are named the other way round: a cloud provider
takes the vendor's own name from the catalogue (OpenRouter, not
openrouter.ai), and a static one is named by whoever adds it — on the
Providers screen, or with PATCH /admin/providers/{id}.
There is no RBAC on providers
A provider is an endpoint and a credential for reaching it. The credential is the provider's own — an OpenRouter key, a vLLM server's auth — defined by the provider rather than by us, and it is the whole of what a provider needs to work.
Registering one needs a token and nothing more. That is safe because registering is not an exposure: a model learned from a registered host reaches nobody until an operator points a frontend model at it, and a frontend model is where access is actually granted. A permission guarding registration would be guarding a door that opens onto nothing.
What registration deliberately cannot do is convert a provider a human typed in into one that expires — a static provider stays static, so an agent cannot take over an endpoint someone configured by hand.
That leaves a gap worth knowing about: put an agent on a host whose endpoints
were already configured by hand, and it will register them happily and change
nothing. Every line will read kind=static leased=False, and the lease, the
degradation and the model reconciliation will all be doing nothing. The
handover is an operator's explicit act:
curl -sk -b /tmp/ck -X PATCH https://control:4001/admin/providers/4 \
  -H 'content-type: application/json' -d '{"kind":"dynamic"}'
and {"kind":"static"} takes it back, clearing the lease and any degradation
with it.
Any engine, in a container or not
Every engine worth naming answers GET /v1/models — vLLM, SGLang,
llama.cpp's server, TGI, Ollama, Triton's OpenAI frontend, LM Studio, mlx-lm —
as do the hosted providers. So neither the agent nor the control plane needs to
know which one it found. An unrecognised engine is registered like any other; it
simply contributes no metadata.
There is no container mode. A port probe finds a process however it was started.
What the control plane does with it
Every --provider-sweep-interval (60s by default), one GET /v1/models per
provider answers both questions that matter:
- is it reachable — the ordinary health question
- is it still serving what is registered against it — the drift question, which is the one that started all this
A provider serving more than is registered is healthy, not drifted. OpenRouter answers with hundreds of models and three of them are registered; treating the extras as drift would mark every cloud provider broken.
Degrade, then delete
A failed probe or a lapsed lease marks the provider degraded: its models go out of rotation, and nothing is deleted. Only after 30 minutes of sustained absence is a dynamic provider removed.
Two stages, never one. A 27B on a DGX Spark takes over ten minutes to load and answers nothing while it does, and a host reboot is routine. Deleting on the first failed probe would make every restart look like a decommissioning — and deleting a provider throws away its credential. Suppressing routing is reversible; deletion is not.
[!IMPORTANT] Static and cloud providers never expire. They are probed on the same schedule, but the result is advisory: it reports drift an operator would otherwise find by accident. A human put them there, and absence is not evidence the human changed their mind.
A learned model is inventory, not an exposure
A model that appears on a registered host is registered as a provider model — and reaches nobody. Nothing creates a frontend model for it.
That is deliberate. Authorisation is granted on frontend models, so a host starting an unrelated model must not hand existing principals access to it. New inventory is closed by default; exposing it is a decision someone makes, by pointing a frontend model at it.
What survives a provider being deleted
- Usage and spend.
usage_eventsrecords the model and provider name at ingest, so history outlives the row (migration 0031). - Frontend models and their targets. A target is bound by name, so deleting the provider model leaves the target in place, unresolved — and re-registering the same model on the same provider reattaches routing with no manual step (migration 0036).
- Grants, which are held on frontend models rather than on provider models.
Each of those is there because the alternative was demonstrated: the provider decomposition revoked live grants, would have failed the retention batch outright, and silently halved a frontend model's capacity — all three found by deploying and making a real request.
Security model
Who can call what, how secrets are stored, and where the trust boundaries are. The detail behind each claim here is in the API reference; this page is the map.
Three kinds of caller, three mechanisms
They are separate on purpose. A password proves a human is who they say; a random key identifies a service; a proxy token says "I am a process in this deployment". Collapsing any two of them means one leak costs more than it should.
flowchart TB
    subgraph DP["data plane · :4000 · public"]
        direction TB
        C["client<br/>Bearer sk-…"] --> K["SHA-256 → principal<br/>401 if unknown or expired"]
        K --> G["model:invoke grant?<br/>403 if not"]
        G --> L["rate limit · budget<br/>429 · 402"]
        L --> U["forward upstream"]
    end

    subgraph AP["admin plane · :4001 · not public"]
        direction TB
        H["operator<br/>name + password"] --> S["Argon2id verify<br/>→ fastllm_session cookie<br/>HttpOnly · SameSite=Strict · 12h"]
        S --> P["per-route permission?<br/>403 if not"]
        P --> A["/admin/* · every write audited"]
        X["proxy process<br/>Bearer pt-…"] --> Y["/snapshot · /usage<br/>/limits/reconcile"]
    end

    U -.->|"never reaches"| AP
| caller | credential | verified with |
|---|---|---|
| A client calling the gateway | API key, sk-… | SHA-256 |
| A human using the admin UI | password → session cookie | Argon2id |
| A proxy replica talking to its control plane | --proxy-token | constant-time compare |
Keys hash with SHA-256, passwords with Argon2id, and that difference is deliberate. An API key is high-entropy random, so the only attack is stealing it and a fast hash costs nothing; a password is low-entropy and human-chosen, so it needs a hash that is slow on purpose. Unifying them would either make key verification needlessly expensive on the request path or make password cracking cheap. Do not unify them.
Authorisation is not authentication
A valid session establishes who is calling. Every /admin/* handler then
checks what that principal may do:
| permission | |
|---|---|
config:write | Models, backends, frontend models, principals, roles, limits |
key:create / key:revoke | API keys |
usage:read | Usage, spend, audit, metrics |
model:invoke | Per model, and the only one the data plane checks |
A principal that can log in is not, by that fact, an administrator. This closed a real gap: any principal a password had ever been set for used to be a full admin, because nothing checked past "is this a valid session".
A grant on a frontend model covers the chain it routes to. A frontend model is how a model is exposed, so it is what gets granted, and a request naming one is authorised against it.
The trade that comes with it, stated plainly: adding a target to a frontend
model extends the reach of everyone holding it, with no new grant on record.
What makes that acceptable is that editing a frontend model requires
config:write, which is all-or-nothing and already lets its holder grant
themselves any model outright — so it is not a route to anything they could not
take directly.
The rule it replaced required a grant on the resolved provider model. That pinned every grant to a provider model's name, so renaming one revoked access with nothing reporting it — which migration 0029 did on the dev cluster, to two live roles. Provider models are not client-facing names at all now, so a frontend model cannot be bypassed by naming what it routes to.
What is stored, and in what form
| stored as | readable back? | |
|---|---|---|
| API keys | SHA-256 hash + prefix | No. Plaintext shown once at creation |
| User passwords | Argon2id | No |
| Session tokens | random, server-side | No |
| Upstream provider credentials | AES-256-GCM at rest | Not through the API — only whether one is set |
No route returns a credential. api_keys.hash is a verifier, not a
display value, and is in no response body.
upstream_api_key is the one secret that cannot be reduced to a hash — the
proxy has to present it to the backend as a bearer token — so it is encrypted
with FASTLLM_ENCRYPTION_KEY (32 bytes, openssl rand -hex 32) before it
reaches Postgres, and --role control/all refuses to start without the key
rather than falling back to plaintext.
Be precise about what that buys: it protects the database, not the
snapshot. Someone with read access to Postgres — a backup, a replica, a
leaked pg_dump — no longer gets every upstream credential for free. It does
nothing about /snapshot, which necessarily carries the credential in usable
form.
The one boundary to get right
/snapshot returns decrypted upstream credentials to anything holding the
proxy token, because the data plane cannot present a credential it cannot
read. Three consequences, and they are not negotiable:
- The admin port must never share an address with the gateway. Its callers hold inference keys and have no business reaching it.
/snapshotmust be TLS wherever a backend has a real credential.--tls-cert/--tls-key, and--ca-bundleon the proxy side for a privately-issued certificate.- The proxy token is a credential-bearing secret, not a service
discovery detail. Generate it (
pt-$(openssl rand -hex 24)), keep it in a Secret, and rotate it like one.
Exposing the admin Service at all rests on three properties holding together:
a session-authenticated admin API, TLS, and a private network. Take away any
one and it should go back to ClusterIP. The manifests in deploy/ say so
where the decision is made, rather than here where nobody applying them would
read it.
Every change is recorded
Every mutating admin call is audited before it is written, with the actor and the target. Three absences are deliberate:
- Reads are not recorded. It answers "what changed", not "who looked".
- Rejected attempts are not recorded. A 403 wrote nothing, and an audit log that fills with them is one nobody reads.
- The request body is never captured. It carries passwords and upstream credentials, and an audit log is exactly the wrong place to put them.
A failed audit write never fails the request. Losing a row is serious; losing the change and the record of it is worse.
Defaults that are deliberately inconvenient
| No default password | A fresh database has no login anyone can obtain. set-password is run once by whoever already holds cluster access |
--host is loopback | Binding 0.0.0.0 is an act |
| Keys expire in 90 days | Not "never" |
| A new principal holds nothing | Its key authenticates, then gets 403 on everything until it is given a role |
--role proxy is the default | The role that needs no database, no encryption key, and no admin surface |
Reporting something
Security issues go to the repository's private advisory form rather than a public issue. If a claim on this page is false, that is itself the report — this repository has shipped a doc claiming credentials were encrypted before they were, and it was review that caught it, not the author.
Where next
| API and administration | Route-by-route detail, and the session cookie's flags |
| Operations | Which deployment shape puts what on the public port |
| Architecture | Where each check happens, and why none of them is I/O |
Command-line reference
Every flag and every subcommand. fastllm-proxy --help prints the same thing
from the binary you are actually running, which is the version to trust if
this page and it ever disagree.
Most flags also read an environment variable — FASTLLM_ plus the flag in
upper snake case — and the flag wins where both are given. That is what makes
a container configurable without an entrypoint script. The exceptions are the
tuning knobs that a deployment sets once and a container never overrides:
--policy, --admin-port, --snapshot-cache, --workers, --max-retries,
--max-body-mb, --pool-max-idle, --upstream-timeout, --health-interval,
--health-timeout and --engine-scrape-interval are flags only. --help on
your own binary is the authority: it prints [env: …] beside every flag that has one.
Subcommands
Run with no subcommand, it is the gateway. The five subcommands are operator
tools, and each takes its own --database-url so none of them has to be issued
alongside --role.
import | Seed models, backends and keys from a LiteLLM config |
set-password | Create or reset an admin login |
sync-prices | Fill in model prices from a published catalogue |
reencrypt-backends | One-shot migration of pre-encryption credentials |
classify-bench | Measure the classifier where it actually runs |
import
fastllm-proxy import --config litellm_config.yaml --database-url postgres://...
The migration path off a file-driven deployment. Idempotent: run it once per environment, or again after editing the file — grants dropped from the file are revoked rather than left behind, so re-importing converges instead of accumulating.
It seeds providers, provider_models and the auth: block: a
service_account principal per key, the key as a SHA-256 hash, and its model
grants as a role named import:<name>. models: ['*'] becomes model:invoke
on model/*; a named list becomes one grant per model.
It never prints a key back. The config file remains the only copy of any plaintext.
set-password
fastllm-proxy set-password --name you --password 'change-me' \
  --database-url postgres://...
The one gap the admin API cannot close on its own. PUT /admin/principals/{id}/password is gated behind a session cookie, and a
freshly migrated database has no session anyone can obtain — so this is how the
first login gets one, run by whoever already holds cluster access.
Creates the principal if the name is new, and grants it admin unless it
already holds a role granting config:write. Checking for the permission
rather than for "any role at all" is deliberate: the seeded bootstrap
principal already holds inference, and a laxer check would turn it into an
account that can log in and administer nothing.
Safe to run again to reset a forgotten password. --password also reads
FASTLLM_BOOTSTRAP_PASSWORD, which is the form to use if your shell history is
somewhere you would rather a password was not.
sync-prices
fastllm-proxy sync-prices --database-url postgres://... --dry-run
--source | open-router, catalogue, or both (default) |
--overwrite | Replace prices already set, not only fill in the missing |
--dry-run | Report what would change and write nothing |
Only touches models whose price is unset unless --overwrite: an operator who
entered a negotiated rate should not have it replaced by a list price on the
next run.
This is the fallback source. Where a provider reports what it actually
charged — OpenRouter returns usage.cost unasked — that figure wins and
nothing here competes with it.
reencrypt-backends
fastllm-proxy reencrypt-backends --database-url postgres://...
One-shot migration for providers.upstream_api_key rows still holding
pre-encryption plaintext. Safe to run more than once; an already-encrypted row
is left alone. Needed once, by deployments that predate
migrations/0004_encrypted_upstream_api_key.sql.
classify-bench
kubectl exec deploy/fastllm-proxy -- fastllm-proxy classify-bench --concurrency 8
--iterations | Default 20 |
--concurrency | Default 4 — so the refined tier's session mutex is visible rather than inferred |
It ships inside the image on purpose. The refined-tier cost in the classifier chapter was first measured on a laptop and the deployed container turned out to be more than an order of magnitude slower. Guessing at why — thread counts, core quotas, token windows — is what this exists to stop: it measures the pod's real CPU quota rather than a developer's machine.
Flags
Roles and planes
| flag | default | |
|---|---|---|
--role | proxy | all, control, or proxy. See Roles |
--database-url | — | Required by all and control; unused by proxy |
--control-url | — | Control plane to poll in proxy mode. Absent means File mode |
--proxy-token | — | Presented to a control plane by proxy; required of callers by all/control |
--snapshot-cache | /var/lib/fastllm/snapshot.json | Last-known-good snapshot, so a control-plane outage degrades to "stops learning about changes" rather than "stops serving" |
--admin-port | 4001 | Admin API bind port (all/control) |
--snapshot-rebuild-interval | 5 | Seconds between control-plane rebuilds independent of admin writes |
--provider-sweep-interval | 60 | Seconds between provider probes: one GET /v1/models each, answering both whether it is reachable and whether it still serves what is registered |
--rate-limit-reconcile-interval | 5 | Http-mode proxy only. 0 disables |
Listener
| flag | default | |
|---|---|---|
--host | 127.0.0.1 | Loopback deliberately — binding 0.0.0.0 is an act, not an accident. The Docker image sets it |
--port | 4000 | The gateway |
--config | — | LiteLLM-format config. Required in File mode; elsewhere only for the fastllm: tuning block |
--max-body-mb | 64 | Largest request body accepted |
--workers | core count | Worker threads |
--tls-cert / --tls-key | — | PEM chain and key for the admin listener. Absent means plain HTTP — legitimate for a dev deployment with no real backend credentials, and not otherwise, because /snapshot carries usable ones |
--ca-bundle | — | Extra CAs trusted alongside the system roots. The normal case for an in-cluster cert-manager certificate |
Routing and upstreams
| flag | default | |
|---|---|---|
--policy | cache-affinity | Also least-loaded, round-robin, lowest-latency. See tuning affinity |
--upstream-timeout | 120 | Seconds to wait for response headers. Does not bound generation — a long completion is not a hung request |
--max-retries | 2 | Alternate backends tried when one fails before any bytes are sent. After the first byte there is nothing to retry onto without lying to the client |
--pool-max-idle | 256 | Idle upstream connections kept per backend |
--health-interval | 10 | Seconds between health sweeps |
--health-timeout | 3 | Seconds a probe may take before it counts as a failure |
--engine-scrape-interval | 2 | Seconds between reads of each backend's Prometheus /metrics, which is what max_inflight_per_backend counts against. 0 turns it off |
--health-report-interval | 10 | Seconds between health reports to the control plane. Backend health exists only in the data plane, so this is the only way the UI can see it |
--config-poll | 5 | Seconds between snapshot refreshes. 0 disables the watch; in File mode SIGHUP is then the only reload |
Cache
| flag | default | |
|---|---|---|
--cache-max-entries | 4096 | |
--cache-max-bytes | 67108864 |
Both matter, and neither alone is enough: a thousand embedding responses is nothing and a thousand completions is hundreds of megabytes, so a single ceiling leaves the other dimension unbounded. Only models that turn caching on ever reach them.
Observability
| flag | default | |
|---|---|---|
--log | info | |
--log-format | text | json for a log collector |
--webhook-url | — | POSTs JSON when a backend goes down or recovers, or a snapshot rebuild fails. all/control only — these are things the control plane learns |
--webhook-secret | — | Signs each body with HMAC-SHA256 in x-fastllm-signature |
--otel-endpoint | — | Requires --features otel. Transport is read from the address: :4317 is gRPC, a /v1/traces path or :4318 is HTTP |
--otel-protocol | inferred | grpc or http, when a proxy in front hides both signals |
--otel-header | — | key=value,key2=value2 on every export. How a hosted backend is reached. Never logged — only the count is |
--otel-sample-one-in | 100 | Tracing every request on a hot path is its own performance problem |
Classifier
| flag | default | |
|---|---|---|
--classifier-model | image path | Fast tier. Requires --features classifier |
--classifier-tier2-model | image path | Refined tier. Requires --features classifier-tier2 |
Shutdown
| flag | default | |
|---|---|---|
--max-inflight-body-mb | 512 | Request bodies held in memory at once, across all requests (FASTLLM_MAX_INFLIGHT_BODY_MB). A request that cannot get its share within 5s is refused with 503. Keep it well under the memory limit: a body is briefly held twice |
--shutdown-delay | 5 | Seconds to keep accepting after SIGTERM while /readyz already answers 503, so the Service stops routing here before the listener closes. Runs before --shutdown-grace |
--shutdown-grace | 25 | Seconds to let in-flight requests finish after SIGTERM. Kubernetes SIGKILLs at terminationGracePeriodSeconds (30 by default), so this sits under it. 0 exits immediately |
Secrets that are not flags
Three values are environment-only, because a flag ends up in a process listing and these should not:
FASTLLM_ENCRYPTION_KEY | Encrypts providers.upstream_api_key at rest. Not regenerable — lose it and those credentials are unrecoverable; change it without running reencrypt-backends and the process will not start |
FASTLLM_PROXY_TOKEN | Also a flag, but the variable is the form to use |
FASTLLM_BOOTSTRAP_PASSWORD | set-password's --password |
Where next
| Operations | The five deployment shapes, and where each flag lands |
| API and administration | Every HTTP endpoint |
| Architecture | What the roles actually do |
API and administration
fastllm-proxy --config litellm_config.yaml --host 127.0.0.1 --port 4000
Point clients at it as an OpenAI endpoint:
curl http://localhost:4000/v1/chat/completions \
  -H 'Authorization: Bearer sk-...' \
  -H 'content-type: application/json' \
  -d '{"model":"Qwen/Qwen3-1.7B","stream":true,"messages":[{"role":"user","content":"hi"}]}'
Reload after the model set changes — no restart, no dropped streams:
kill -HUP $(pgrep -x fastllm-proxy)
The machine-readable version of everything below is openapi.json,
served by the running control plane at GET /openapi.json with Swagger UI at
/docs. It is checked against the router by tests/openapi.rs in both
directions — a route without a spec entry fails the build, and so does a spec
entry whose route no longer exists.
In this section
| Interactive API reference | Swagger UI over openapi.json, browsable here without a deployment |
| The endpoints clients call | The proxied surface, what is not proxied, the response cache, rate-limit headers and retries |
| Admin API | Models, backends, keys, principals, prices, live health, and the audit log |
| Routing rules | The rule grammar, and the dry-run that answers which rule would decide |
| Authentication, sessions and TLS | Sessions, per-route permissions, encryption at rest, and which listener must be TLS |
| The control-plane protocol | /usage, /health-report, budgets and rate-limit reconciliation |
Provider base URLs and the translation limits moved to Providers. Every flag is in the command-line reference.
Interactive API reference
Every endpoint, with its request and response shapes, from the same
openapi.json the running control plane serves at GET /openapi.json.
The spec is checked against the router by tests/openapi.rs in both
directions — a route with no spec entry fails the build, and so does a spec
entry whose route no longer exists — so this cannot drift from the code the
way a hand-written endpoint list does.
Against your own deployment
The control plane serves the same two routes, and there Try it out works:
GET /openapi.json | The spec |
GET /docs | Swagger UI |
Both sit on the admin listener (:4001) alongside /healthz, and both
are outside the session gate — a spec is not a secret and a probe target
cannot hold a cookie. Everything they describe under /admin/* still
requires a session and a per-route permission.
kubectl -n fastllm port-forward svc/fastllm-control 4001:4001
open https://localhost:4001/docs
Generating a client
npx @openapitools/openapi-generator-cli generate \
  -i https://your-control-plane:4001/openapi.json \
  -g typescript-fetch -o ./fastllm-client
The gateway's own endpoints are OpenAI-shaped, so an OpenAI SDK is the better client for those — see Connecting a client. This is for the admin API, which has no SDK and is where a generated client earns its keep.
The endpoints clients call
What the gateway serves on :4000, what it deliberately does not, and
the headers and retry behaviour that come with each.
| Endpoint | Purpose |
|---|---|
POST /v1/chat/completions | Proxied byte-for-byte. Also /completions, /responses, /embeddings, /rerank, /score, /audio/transcriptions, /audio/translations, /audio/speech, /images/generations, /images/edits, /moderations |
POST /v1/messages | Anthropic Messages API, for Claude Code and the Anthropic SDKs: point ANTHROPIC_BASE_URL here. Translated to a chat completion and served by the normal path, so routing, budgets, rate limits and RBAC apply unchanged. Streaming, tool_use/tool_result, images, stop_reason and usage (cached tokens included) are mapped; a backend's reasoning becomes thinking blocks, while thinking blocks a client sends back are dropped. The key may arrive as x-api-key or Authorization: Bearer. POST /v1/messages/count_tokens answers with an estimate (about four characters a token), locally. GET /v1/models returns the Anthropic shape when the request carries anthropic-version |
GET /v1/models | Aggregated across every pool, filtered to what the calling key may invoke. A frontend model is listed when the caller can invoke any model it routes to. Clients build model pickers from this, and offering names that 403 on selection is a defect the authorisation being correct does not excuse |
GET /health | Per-backend health, in-flight, request and error counts, plus snapshot_version and the key count for the configuration this process is serving. No auth required. Exposes backend addresses — keep it off the public interface |
GET /metrics | Prometheus text, including fastllm_snapshot_version. No auth required |
/admin/* | --role all/control only. Gated by a session cookie (POST /login), not --proxy-token — see the table below and "Admin authentication" underneath it |
POST /login / POST /logout | --role all/control only. Argon2id password check; sets/clears the fastllm_session cookie every other /admin/* route requires |
/, /ui/* (management UI) | --role all/control only. The embedded SPA — see "Management UI" below |
GET /snapshot | --role all/control only. What --role proxy polls in Http mode; gated by --proxy-token |
POST /usage | --role all/control only. Batched usage reporting from --role proxy (see "TLS and the reverse channel" below); gated by the same --proxy-token as /snapshot |
POST /limits/reconcile | --role all/control only. Rate-limit count reporting from --role proxy (see "Rate limits" below); gated by the same --proxy-token |
Endpoints, and what is not one
Twelve POST endpoints are proxied. All of them take the same path: read
model from the body, authorise it, route it, forward the bytes. Nothing on
that list is parsed on the way back, so adding one costs a line — which is why
/responses, /audio/speech, /images/* and /moderations are there.
A native (anthropic/gemini) backend answers 501 for everything except
/chat/completions, because only chat has a translation. That gate is what
makes adding a passthrough endpoint safe: a native backend refuses it clearly
instead of being handed a body it cannot read.
What is deliberately absent, and why it is not a line of config. The
stateful job APIs — /batches, /files, /fine_tuning — are not endpoints so
much as small databases. Creating a job is a POST with a model in it, which
would work; retrieving one is a GET /v1/batches/{id} with no model and no
body, so there is nothing to route on. Serving them means remembering which
backend owns which job id, which is durable state on the request path — the one
thing this proxy is built not to have. They need a design, not a suffix.
Response cache
Off unless a model asks for it:
-d '{"name":"embeddings","cache_ttl_seconds":300}'
An identical request to that model — same resolved model, same body — is
answered from memory without touching the provider. Responses carry
x-fastllm-cache: hit or miss, because a caller measuring latency deserves
to know why one request took a microsecond and the next took a second.
Opt-in per model rather than global, because caching changes semantics: two
identical requests at temperature > 0 are supposed to be able to differ. A
deployment that sets nothing pays nothing, not even the hash — that is only
computed once a model is known to have caching on.
How large a context a name accepts
GET /v1/models reports max_model_len and context_length on each entry —
both spellings, because vLLM's own endpoint uses the first and OpenRouter the
second, and emitting one leaves half the ecosystem guessing.
The number is the smallest window across everything the name can reach, not the largest. A frontend model may route to several models and which one serves a request is not the client's to know, so the only figure it can safely size a session against is the one that fits wherever it lands. Reporting the largest works until the request that spills onto a smaller backend.
An explicit max_model_len on the frontend model wins outright: that is an
operator saying what the name promises, and it is allowed to be smaller than
the backend permits.
The figure comes from the engines themselves and stays current without
anyone maintaining it. --max-model-len is chosen when an engine starts, so a
restart can change it without touching a row — the health probe already
fetches each backend's own /models and now reads the window out of the
response it was discarding, at no extra request. A value recorded on the
provider model is the fallback, for providers that publish nothing.
That matters beyond reporting: routing demotes a model whose window is smaller than the prompt, so a stale figure either sends an oversized prompt to an engine that will reject it, or stops routing to one that grew.
Where nothing reachable has said, the fields are omitted rather than guessed. A client that trusts an invented number sizes a prompt to it and collects the upstream rejection this exists to prevent.
Why a request went where it went
Every response carries two more headers:
| header | says |
|---|---|
x-fastllm-route | which decision served it: concrete, rule:2, default, or jump:house-policy>rule:0 |
x-fastllm-served-model | the provider model that actually answered |
The pair exists because the delta between the two was recorded and the cause
never was. max_inflight_per_backend is not a pure function of the request —
two identical prompts a second apart can legitimately route differently — so a
quality regression in an eval tool had two indistinguishable explanations: the
prompt changed, or the local pool was busy. These tell them apart.
A header rather than only a span, because the head sampler traces one request
in --otel-sample-one-in, and the request somebody investigates is rarely the
one that happened to be sampled. The same string is on the span as route,
and POST /admin/routing/dry-run returns it as reason, so a dry run and a
real request describe a decision identically.
Non-streaming 2xx responses only. Caching a stream would mean buffering the whole response before any of it reached the client, turning the one path this proxy exists to keep incremental into a batch operation. Errors are never cached: a 429 is a statement about now, and serving it from cache would keep a provider's bad minute alive long after it ended. The natural fit is embeddings and short completions, which are the requests that repeat.
The cache is per process, bounded by --cache-max-entries and
--cache-max-bytes (both matter: a thousand embedding responses is nothing and
a thousand completions is hundreds of megabytes). A shared cache would mean a
network call, and the request path performs no I/O — a lower hit rate across
replicas is the honest cost of that invariant.
A cache hit still counts against the caller's rate limit and budget. A cache is a latency and cost optimisation, not a way around a quota. And the whole cache is dropped whenever a snapshot changes, since a reconfiguration can repoint a model at a different provider and there is no way to tell from a key which entries are affected — a cold cache is a latency cost where a stale one is a correctness bug.
Rate limit headers
Every response from a principal with limits configured carries the de-facto
x-ratelimit-* shape, so a client that already paces itself against OpenAI
needs no new code:
x-ratelimit-limit-requests / x-ratelimit-remaining-requests
x-ratelimit-limit-tokens   / x-ratelimit-remaining-tokens
x-ratelimit-reset
Remaining is floored, not rounded — 0.6 of a request is not one a client can
spend. x-ratelimit-reset is seconds until the allowance is fully back; a
token bucket has no discrete window to reset, so that is the honest reading,
and a full bucket reports 0. A principal with no limits gets no headers at all,
because publishing remaining: 0 to an unlimited caller would make a
well-behaved client back off against a limit that does not exist.
Retries
A retry waits 25ms, then 50ms, then 100ms, plus up to 50% jitter, and doubles
that for a 429 — a provider that just said "too many requests" means it.
Bounded deliberately: the delay is paid by a client still waiting for its
answer, so this is a retry budget measured against one request's patience, not
a background job's. Jitter is keyed on the request rather than an RNG, since
the data plane has no random source in a --no-default-features build and all
that matters is that simultaneous retries decorrelate.
Admin API
Everything under /admin/* on the control plane: models, backends, keys,
principals, prices, health and the audit log.
Everything an operator needs to run the control plane, so that neither raw SQL nor a second import run is the documented way to change policy. Every mutating route rebuilds and republishes the snapshot on the spot, so a change reaches --role proxy within one --config-poll interval rather than waiting on the control plane's own periodic rebuild.
| Endpoint | Purpose |
|---|---|
GET /admin/principals | Principals with their roles |
POST /admin/principals | {"name":..., "kind":..., "email":...}. kind is service_account (the default) or user |
DELETE /admin/principals/{id} | Cascades to that principal's keys and role grants |
POST /admin/principals/{id}/roles | {"role":"inference"}. Idempotent |
DELETE /admin/principals/{id}/roles/{role} | Revoke one role |
PUT /admin/principals/{id}/password | {"password":...}. Argon2id-hashes it and promotes the principal to kind = 'user' if it was not already |
GET /admin/keys | Prefix, name, principal, expiry, disabled. Never the key or its hash |
POST /admin/keys | {"name":..., "principal_id":..., "expires_at":...}. Returns the plaintext key once |
DELETE /admin/keys/{id} | Revoke (sets disabled; the row stays for audit) |
GET /admin/provider-models | Models, each with the provider serving it. Reports whether the provider has an upstream credential, never the credential. A model with no provider is listed with an empty backends — not routable, and shown rather than hidden |
POST /admin/provider-models | {"name":..., "description":...} |
DELETE /admin/provider-models/{id} | Deletes the model. The provider stays: other models may be on it |
POST /admin/provider-models/{id}/backends | Attach the model to a provider. Either {"provider_id": 7} — the address, protocol and credential come from that row, and any field describing an endpoint alongside it is a 400 rather than silently ignored — or the address itself: {"api_base":..., "upstream_model":..., "upstream_api_key":..., "protocol":..., "auth_header":..., "auth_scheme":..., "default_max_tokens":...}. Everything after the credential is optional and defaults to an OpenAI-compatible upstream reached with Authorization: Bearer. The provider is reused when one already serves that api_base and auth, so a credential is stored once however many models ride on it, and is encrypted before it reaches Postgres and cannot be read back. 409 if the model already has a provider — a provider model has exactly one; two upstreams behind one client-facing name is a frontend model with two targets |
DELETE /admin/backends/{id} | Detach a model from its provider. The id is the model's — the model is its own link. Price, usage history and any frontend model pointing at it are untouched; it simply stops being routable |
GET /admin/providers | Every provider: its kind (static, cloud, dynamic), endpoint, protocol, whether a credential is set, the node vouching for a dynamic one, and how many models ride on it. A provider used to be a grouping the UI invented at render time; it is a row |
POST /admin/providers | {"name":..., "kind":..., "catalogue_key":..., "api_base":..., "protocol":..., "auth_header":..., "auth_scheme":..., "upstream_api_key":..., "credential_kind":...}. The endpoint is dialled before the row is written, and nothing is stored unless it answers with its models. A rejected credential, an unreachable address and a path that has no model list are all a 400 with nothing saved. The last is refused deliberately: a 404 says the host is there and this path is not, which is overwhelmingly a mistyped api_base. There is no way to skip the check — a provider is an address and a credential, and neither is worth storing unverified. All optional but for an address, which catalogue_key can supply. kind is static or cloud; dynamic is refused, because a lease is something a registering host takes out and keeps refreshing. A catalogue base URL with a <placeholder> still in it is a 400: storing it would produce a provider that resolves nowhere and then reports itself unreachable. 409 on a duplicate name, or on a second provider at the same address with the same auth — that tuple is how attaching a backend finds one |
PATCH /admin/providers/{id} | {"name":..., "kind":..., "api_base":..., "protocol":..., "auth_header":..., "auth_scheme":..., "upstream_api_key":..., "credential_kind":...}. kind moves an endpoint between static/cloud and dynamic — the only way to hand one a human typed in over to the agent on its host, since registration deliberately never converts a static provider into one that can expire. Leaving dynamic clears the lease and any degradation with it, because the sweep reads lease_expires_at whatever the kind and an expired one would report the provider unreachable for ever. Becoming dynamic leaves the lease NULL, which the sweep reads as "not lapsed", so it is probed on its merits until its agent beats. Rotation is the other reason this exists: one credential serves every model on a provider, so replacing it is one write rather than one per model. An absent upstream_api_key leaves the stored one alone; "" clears it. An absent field is left alone throughout |
GET /admin/provider-catalogue | Known providers and how to reach them: base URL, protocol, auth header, and the credential_kinds each accepts — only Vertex AI has more than static, so the UI asks that question only where there is an answer to give. Covers the entries docs/providers.md documents an endpoint for — it names about a hundred providers and gives a host for thirty-odd, and seeding the rest would mean inventing base URLs. A convenience, never a limit: anything speaking the OpenAI API works whether or not it is listed |
POST /admin/providers/register | {"api_base":..., "node":..., "name":..., "engine":..., "ttl_seconds":...}. name is the agent's: it is the thing that knows what the endpoint is, where the control plane only ever saw an address. Sent on every heartbeat, so changing it on the agent renames the provider — safe because routing resolves a target by its model's name, never its provider's. A name another provider already holds is declined with a warning and the heartbeat still succeeds, since a collision is no reason to let a lease lapse. Registers or refreshes a dynamic provider's lease. Needs a token and nothing more — registering is not an exposure, since a learned model reaches nobody until a frontend model points at it. Never converts a provider a human configured into one that can expire |
GET /admin/providers/{id}/available-models | What that provider is serving right now, from the same GET /v1/models the sweep uses, with the already-registered ones marked. Registers nothing: OpenRouter answers with hundreds. 502 if the provider does not answer |
DELETE /admin/providers/{id} | Removes a provider that serves no models. 409 while any remain, naming them — a cascade would take frontend model targets and usage history with it |
GET /admin/prompt-classes | Classes, example counts, and whether each is routable (has a centroid) |
POST /admin/prompt-classes | {"name":..., "tier":"fast"|"refined", "min_margin":..., "refines":[...], "examples":[...]} |
POST /admin/prompt-classes/{id}/examples | Add one example prompt |
DELETE /admin/prompt-classes/{id} | Cascades to its examples and refinements |
POST /admin/prompt-classes/evaluate | Per-class precision, recall, margins, nearest neighbours and a verdict — leave-one-out over your own examples |
GET /admin/fallback-model | The model every routing chain falls back to |
PUT /admin/fallback-model | {"model_id": 42} to set it, {"model_id": null} to clear it |
PATCH /admin/principals/{id} | {"name":..., "email":...}. Safe to rename: keys, roles, limits, budgets and usage all reference a principal by id. usage_events records the name rather than referencing it, and is left alone — it says who a request was billed to at the time it was served |
PATCH /admin/roles/{name} | {"name":..., "description":...}. A role's grants and its holders reference it by id, so renaming changes only the URL it is addressed at. A role carries no grant of its own — permissions.resource names models, servers and agents, never roles |
GET /admin/roles | Roles and the permissions each one grants |
GET /admin/limits | Every principal with a configured rate limit |
PUT /admin/principals/{id}/limits | {"requests_per_min":..., "tokens_per_min":...}. Either or both; upserts the one row this principal may have |
DELETE /admin/principals/{id}/limits | Remove the limit — the principal becomes unlimited, not limited to zero |
GET /admin/budgets | Every principal with a configured token budget, including current consumption |
PUT /admin/principals/{id}/budget | {"tokens_total":..., "window":"daily"|"weekly"|"monthly"}. Upserts the one row this principal may have; leaves tokens_used and the window's start alone on an update |
DELETE /admin/principals/{id}/budget | Remove the budget — the principal becomes unlimited, not limited to zero |
PATCH /admin/provider-models/{id} | Correct a model in place: {"description":..., "input_price_per_mtok":..., "output_price_per_mtok":..., "cache_ttl_seconds":..., "context_length":...}. Every field optional; an explicit null clears, an absent field is left alone. context_length must be positive — a model that accepts no tokens is not a thing, so 0 is refused rather than read as "undeclared" |
POST /admin/roles | {"name":..., "description":...}. Permissions attach to roles, so a role is the only place to express "this caller may reach these models and nothing else" |
DELETE /admin/roles/{name} | Refused while any principal still holds it — a cascade would take every holder's access away at once, and the symptom arrives long after the click |
POST /admin/roles/{name}/permissions | {"verb":"model:invoke", "resource":"model/gpt-4o"}. The verb list is closed — a permission nothing checks would read on a matrix as though it granted something |
DELETE /admin/roles/{name}/permissions | Same body; revoke one |
GET /admin/audit | The change log, newest first. ?limit=&before=&actor_id=&target=&since=. before is keyset pagination on the id of the oldest row you hold — an offset would skip or repeat rows as new ones arrive at the head |
GET /admin/usage | Aggregate requests, tokens, latency and spend. ?group_by=model|principal|virtual_model|day&since=&until=&limit=. virtual_model groups on what the caller asked for, which is the only grouping that can answer "how much traffic does each frontend model carry" — by the time a model is chosen the virtual name is gone. Reports unpriced_requests alongside every total: a request whose model has no price contributes nothing to cost, and summing those as zero would understate spend silently |
GET /admin/timeseries | The same facts bucketed over time, for charts. ?since=&until=&bucket=<seconds>&model=&principal_id=. Every bucket in the range is returned, including empty ones as explicit zeros — an aggregate that omits them makes a chart draw a straight line across an outage. Latency percentiles are the exception and come back null for an empty bucket, because zero would read as "instantaneous" rather than "nothing to measure". bucket is a floor, not an instruction: a width finer than the range can afford is widened so the series never exceeds 720 points, and the width actually used is implied by the returned instants |
GET /admin/fleet | What each proxy replica can see — its backends' health, in-flight counts, and the snapshot version it is serving |
POST /admin/routing/dry-run | {"model":..., "streaming":..., "principal_id":..., "class":..., "headers":{...}} → the candidate chain and which rule index decided |
POST /admin/prices/sync | {"source":"open-router"|"catalogue"|"both", "overwrite":..., "dry_run":...}. The same work fastllm-proxy sync-prices does, from a UI |
GET /admin/config | What this process was started with — role, TLS, poll and report intervals, cache bounds, session TTL, classifier tiers, OTLP. Read-only: changing one of these is a deploy |
POST /admin/snapshot/rebuild | Rebuild and republish now. Answers with the version it published, because refresh deliberately does not fail the request that triggered it |
POST /admin/sessions/revoke-all | Delete every session, including the caller's |
No route returns a credential. Key plaintext is shown once, by POST /admin/keys, and never again; api_keys.hash is a verifier, not a display value, and is not in any response. upstream_api_key is the one secret that cannot be reduced to a hash — the proxy has to present it upstream — so it is encrypted at rest and GET /admin/provider-models and GET /admin/providers report only whether one is set.
Audit log
usage_events records inference. audit_events records the other kind of
action — who created a key, granted a role, raised a budget, repointed a
backend at a different provider. Those are the changes an incident review asks
about.
SELECT at, actor_name, action, target FROM audit_events ORDER BY at DESC LIMIT 20;
Recorded by a layer over every /admin/* route rather than by a call in each
handler, and that is the point: a hand-wired trail records the mutations
somebody remembered to wire, which drifts the moment a route is added. A new
endpoint is audited before it is written.
What that costs is detail — the row says a principal's roles were changed and by whom, not which role. Complete and coarse beats detailed and full of holes, and the application log carries the rest.
Three things are deliberately absent. Reads are not recorded: auditing
every list call would bury the changes in noise — including the handful that
are POST only because they take a body (/admin/routing/dry-run,
/admin/prompt-classes/evaluate), which would otherwise dilute a log whose
value is that every row is a change. Rejected attempts are not
recorded as changes: a 403 is an attempt, and logging it as a change would make
the trail lie in the direction that matters most. And the request body is
never captured — it carries passwords and upstream credentials, and an audit
row is read by more people than the thing it describes.
A failed audit write never fails the request. Losing a row is serious; losing the change as well would be worse, since an operator retrying a failed grant would have no way to tell whether the first attempt applied.
Live backend health
Backend health lives in the data plane: each proxy probes its own backends and
keeps its own in-flight counts. The control plane has never seen any of it — it
publishes a snapshot and hears back only about usage. So GET /admin/fleet
exists, fed by proxies posting to POST /health-report on the same
--proxy-token as /snapshot and /usage, every --health-report-interval
(10s by default).
Reports are kept per replica and never merged. The interesting failures are
exactly the ones where replicas disagree: one proxy that cannot reach a backend
the others can is a network partition, and averaging it into a fleet-wide
"healthy" hides the only symptom there is. Each report also carries the
snapshot version that replica is serving, so a fleet-wide max - min shows a
pod stuck on an old configuration without scraping every one of them.
Nothing is persisted. Health is a statement about now; a row saying a backend was up two hours ago is history, not health. A replica that stops reporting ages out after 30 seconds rather than lingering as "up, 40 minutes ago".
Cost
Models carry a price per million tokens, in micro-units of whatever
currency you quote in — an integer in the smallest unit anyone publishes, so
the arithmetic is exact and there is no rounding mode to get wrong. 3000000
is $3.00 per million tokens.
-d '{"name":"claude-sonnet","input_price_per_mtok":3000000,"output_price_per_mtok":15000000}'
Nobody needs to type them:
fastllm-proxy sync-prices --database-url "$URL" --dry-run
Reads OpenRouter's model list (395 models, unauthenticated) and the community
catalogue (2,499), matches each model by what its backends call upstream —
trying openai/gpt-4o and then gpt-4o, so you need not know which spelling a
source uses — and fills in the prices. --source picks one; --overwrite
replaces prices already set, which it will not do otherwise: a negotiated rate
should not be replaced by a list price on the next run. A source that cannot be
reached is reported and skipped, since filling in half the prices beats filling
in none because GitHub was briefly unavailable.
Where the two disagree, OpenRouter's own published price wins over a third party's copy of it. And the catalogue is a third party's file — correct in practice, occasionally stale, and a dependency on somebody else's maintenance.
Prices are changed in place, and read back:
curl -X PATCH .../admin/provider-models/42 -d '{"input_price_per_mtok":4000000}'
Absent means "leave alone" and an explicit null clears — so correcting a
price does not silently turn caching off, and a model can become unpriced
again. GET /admin/provider-models returns both prices and the cache TTL.
The provider's own figure wins where it gives one. OpenRouter returns
usage.cost unasked, and that is authoritative: it is the amount actually
billed, it already accounts for cache discounts and for a routed alias serving
a different model per request, and it does not go stale when a provider changes
its prices. The configured price is the fallback, not the source. Most
providers report nothing, and those are priced from the table.
Every usage row carries cost_micros, stored rather than derived — a later
price change must not silently rewrite what last month cost. A model with no
price and no reported cost is left NULL rather than zero, so unpriced is
visible instead of looking free. The table fallback rounds rather than
truncating: a small request often costs single-digit micro-units, and
truncating each one undercounts systematically rather than symmetrically.
Budgets cap tokens, money, or both:
curl -X PUT .../admin/principals/42/budget \
  -d '{"cost_total_micros":500000000,"window":"monthly"}'   # $500/month
A request is refused when either cap is reached, and the 402 names which one — "budget exhausted" alone leaves an operator guessing between raising tokens and raising spend. Both counters roll together at the window boundary, since they measure the same window.
min/max_budget_used_percent routing conditions read whichever cap is closest
to its limit, so a rule meant to degrade before the cliff still fires for a
principal running out of money rather than tokens.
Checking a proxy is current. snapshot_version on /health — and
fastllm_snapshot_version on /metrics — is the version of the configuration
that process is actually serving, stamped by the control plane and so
comparable across a fleet. A max() - min() across proxies that is not zero
for more than a poll interval means a pod is stuck on an old configuration.
This matters because a lagging proxy is otherwise invisible: it answers
/health with ok, lists the right models and backends, and misbehaves only
on whichever part of the snapshot changed — most often a key it has never seen,
which looks to the caller like an invalid key rather than a stale proxy.
Vertex AI is the one provider that cannot be reached with a static secret: it wants an OAuth2 access token, and those expire hourly. Give it the service account's JSON key file and say so:
-d '{"api_base":"https://europe-west1-aiplatform.googleapis.com/v1/projects/my-project/locations/europe-west1/endpoints/openapi",
     "upstream_model":"google/gemini-2.5-flash",
     "credential_kind":"gcp_service_account",
     "upstream_api_key":"<the whole service-account JSON key file>"}'
The control plane exchanges the key file for an access token while building each snapshot, caches it until five minutes before expiry, and ships the token. The data plane never learns this backend is different — it presents a bearer credential exactly as it would a static one, and performs no I/O to obtain it. A key file that is not one is rejected when the backend is created, rather than becoming a backend that disappears from routing on the next rebuild. If minting fails later — a revoked key, a role removed — that one backend drops out with the reason logged, and every other model keeps serving.
Anthropic and Gemini speak their own wire formats and are reached by
setting protocol. The auth header and scheme are filled in automatically —
x-api-key plus anthropic-version for Anthropic, x-goog-api-key for
Gemini — so an operator sets neither:
# api_base already carries the version segment each vendor addresses from
-d '{"api_base":"https://api.anthropic.com/v1", "protocol":"anthropic",
     "upstream_model":"claude-sonnet-4-5", "upstream_api_key":"sk-ant-...",
     "default_max_tokens":4096}'

-d '{"api_base":"https://generativelanguage.googleapis.com/v1beta",
     "protocol":"gemini", "upstream_model":"gemini-2.5-flash",
     "upstream_api_key":"AIza..."}'
Two things to know before choosing native over OpenRouter:
-
default_max_tokensis required for Anthropic in practice. Anthropic rejects a request with nomax_tokens; a client that omits one gets a 400 naming this field. It is deliberately not defaulted to an invented number — silently capping generation is the kind of bug nobody finds until they wonder why answers stop mid-sentence. -
Translated backends serve
/chat/completionsonly. Text and tool calling work, streaming included —tools,tool_choice,tool_callsandrole: "tool"messages all translate, in both directions, as do image and audio content parts andresponse_format.n > 1,logprobs,seed, the deprecatedfunctionsparameter, and the embeddings/rerank/audio endpoints return501naming what was unsupported, rather than quietly doing less than was asked. Requests needing those should go to an OpenAI-compatible backend.Structured output translates, with one asymmetry. A
json_schemabecomes Anthropic'soutput_config.formatand Gemini'sgenerationConfig.responseSchema. A bare{"type":"json_object"}— JSON with no schema — maps to Gemini'sresponseMimeTypebut is dropped for Anthropic, which has no equivalent: an empty schema there would constrain the model to{}.Anthropic prompt caching is switched on for you. Anthropic caches nothing unless a block carries
cache_control, and a cache hit costs 90% less than the same input tokens — but an OpenAI-format client has no way to ask for it, so a translated backend paid full price on every request for a prefix identical across all of them. The system prompt now carries the breakpoint. It goes there and nowhere else: the system prompt is the one part of a chat request that is stable across turns by construction, where marking a message would be guessing at which prefix repeats.Media never causes a fetch. A
data:URL carries the bytes inline and translates exactly, base64 untouched. A remotehttps://URL is handed to Anthropic, which fetches it itself; for Gemini it is a501naming the fix, becausefileData.fileUrionly addresses Google's own Files API. The proxy does not download it in either case — that would be a network call while serving a request, whichtests/no_io_on_hot_path.rsforbids. Audio reaches Gemini asinlineData; Anthropic has no audio input, so it is a501rather than an image block with an audio media type that fails upstream.Two details a client can observe. Gemini supplies no tool-call id, so the proxy synthesises one — stable within a response, which is all a client needs to pair a result back to its call. And a Gemini call arrives complete in a single streamed frame where Anthropic's arguments accumulate across several; both are valid OpenAI streams, and a client that concatenates
argumentsbyindexhandles either without knowing which provider answered.
Everything else is unchanged by the choice: RBAC, rate limits, budgets, routing rules and frontend models all work the same against a translated backend, and usage is reported from the provider's own token counts.
Routing rules
The rule grammar behind frontend models, and the dry-run that answers which rule would decide before anything is dispatched.
A frontend model is a client-facing name with an ordered list of rules and a fallback. First rule whose conditions match wins; conditions within a rule are AND'd. Targets are weighted (relative shares, not percentages), and the target list is a fallback chain, not just a split.
| condition | matches on | reads |
|---|---|---|
principals, roles | who is calling | request |
min/max_prompt_tokens | estimated prompt size | request |
min/max_max_tokens | requested generation length | request |
stream | whether the client asked for a stream | request |
headers | exact header values, all must match | request |
min/max_budget_used_percent | how much of the caller's budget is spent | snapshot |
max_inflight_per_backend | how busy this rule's own targets are | live cluster state |
class | which prompt class the classifier assigned — see semantic routing | |
min/max_request_cost_micros | what this request would cost, at the cheapest model this frontend model can reach | prices |
after, before, days, utc_offset_minutes | wall-clock window | clock |
The last two rows are marked because they matter: every other condition is a pure function of the request, so the same request always routes the same way and prefix affinity means something. A load- or time-dependent rule gives that up by design — two identical requests a second apart can legitimately land on different models. Worth choosing knowingly.
What a cost condition is priced against. There is a circularity to get out
of the way: what a request costs depends on which model serves it, and which
model serves it is what the rule is deciding. Comparing against the rule's own
targets would make the condition answer a different question in every rule, and
a deny rule has no targets at all. So the figure is the cost at the
cheapest model this frontend model could reach — one number per request,
computed once before any rule is tested, the same for every rule in the chain.
Well defined, order-independent, and monotone: if the cheapest option is over
the cap, every option is.
That settles what it is good for. "Refuse anything that would cost more than
$0.50 however I route it" is exactly this question, which is why it pairs with
deny. "Send the expensive ones somewhere cheaper" is not a condition at all —
that is the cheapest policy, one level down. A frontend model whose reachable
models are all unpriced has no cost for the request, and a rule naming either
bound does not match: unpriced is unknown, and a guard that fired on unknown
would refuse traffic on the strength of a blank field.
What max_inflight_per_backend counts. The engine's own number where it
publishes one. Every proxy reads each backend's Prometheus /metrics in the
background (--engine-scrape-interval, two seconds by default) and routing
compares the ceiling against what vLLM or SGLang says is running plus queued.
That matters as soon as there is more than one proxy: a per-replica counter
means two proxies each admit up to the ceiling, so a limit of 2 spills at
about 4, and traffic that reached the engine without passing through FastLLM
is invisible. Which backends have this is detected, not configured. Each is asked once, then
every five minutes while it produces no reading, and after fifteen minutes it
is assumed not to have metrics and dropped from the scrape — so a deployment of
hosted providers costs a handful of requests per provider for the life of the
process rather than a poll every few minutes for ever. A backend that answers
with something that is not engine metrics — a 404, or a Prometheus body with
no scheduler families in it — settles sooner, on the second such answer, since
the endpoint has said as much itself. Editing an endpoint starts the detection
over.
The one verdict that is revisited is the one reached by deadline: nothing ever replied, so "it has no metrics" was an inference, and an engine that took longer than fifteen minutes to load a model would be written off by it. Such a backend gets exactly one more question if it later passes a health probe.
Anything not detected as an engine falls back to this replica's own count, and so does a backend whose last reading has gone stale, so the condition degrades to its old behaviour rather than to "idle".
What a rule does when it matches
Every rule has an action, and every action is terminal — the matching rule decides everything about the request, which is what lets a dry-run answer "which rule decided this" with one rule name instead of a trace.
| action | what it does |
|---|---|
route (default) | send the request to this rule's targets, in the order the policy below produces |
deny | refuse, with deny_status (4xx only) and deny_message |
jump | continue evaluation in another frontend model's chain, named by jump_to |
route, failover, balance and split are deliberately not four
actions: all four mean "order a chain, try the head, fall down the list on
failure" and differ only in how the head is picked, which is what policy
says.
deny is 4xx only, refused at write time otherwise. A refusal answered
with a 5xx tells every client library in the world to retry a request that will
never be allowed, and reads in an error-rate chart as the gateway failing
rather than as policy working.
A jump that would close a loop is refused when you create it, by walking
the jumps already stored. The proxy also caps how far it will follow a chain,
because a snapshot can arrive from a hand-edited database — but that is a
backstop, not the mechanism. A jump whose destination has since been deleted
is treated as no match, so the request falls through to the next rule; failing
instead would turn deleting one frontend model into an outage for every other
one that referenced it.
Any rule may also carry a tag, which is copied onto the usage rows that
rule produced. That is a field rather than an action: a rule that tags still
has to route, or there would be no usage row to label. It is what makes spend
answerable per decision rather than only per model.
// Refuse rather than route: expressible for the first time.
{"position": 0, "roles": ["batch"], "min_prompt_tokens": 200000,
 "action": "deny", "deny_status": 413,
 "deny_message": "batch keys are capped at 200k-token prompts"}

// Shared policy, written once and referenced.
{"position": 0, "action": "jump", "jump_to": "<house-policy id>"}

// Attribute this rule's spend without changing where it routes.
{"position": 1, "class": "coding", "targets": ["big"], "tag": "team-research"}
Targets, pools, and the three levels
A rule's targets are an ordered failover chain and nothing else. They are
tried in the order they are written, first to last, on 5xx, 429 or an
unreachable upstream. There is no policy on a rule and no weighted split
between its targets: a target list means what it says.
Choosing between several models at once is what a pool is for. A pool is a named, reusable group of provider models with one policy, and a rule points at it as a single target:
// A pool, created once on Model pools.
{"name": "leastloaded-gemma", "policy": "least-loaded",
 "members": ["gemma-a", "gemma-b"]}

// Any number of rules can then point at it.
{"position": 0, "class": "code", "targets": ["leastloaded-gemma", "gpt-5"]}
Every policy here reads how busy or how warm a member is now. Cost is
deliberately not among them: a price is fixed, so a pool set to "cheapest"
would never balance — it would pick the same member until somebody edited a
price. Cost decides routing through the min/max_request_cost_micros
condition, which is a routing decision made where routing decisions are made.
Naming it is the point. leastloaded-gemma and lowestlatency-gemma can hold
the same members and differ only in how they choose — which a policy buried in
one rule's target list could never express, and which no screen could show.
| policy | picks |
|---|---|
| (unset) | weighted split by member weight, deterministic per conversation |
cache-affinity | the member holding this prefix's KV cache |
least-loaded | fewest in-flight requests |
lowest-latency | lowest recent mean latency |
round-robin | strict rotation |
A pool expands in place. Its chosen member leads, then its other members, then the chain's next target — so a pool degrades into a failover chain of its own members before giving up, which is what makes it safe to use as a single target.
That leaves three levels, each answering a different question and each set in exactly one place:
| decides | set on | |
|---|---|---|
| a rule's targets | the order to try things in | Frontend models |
| a pool | which of several models serves | Model pools |
| a provider model | nothing — it is a model on endpoints; where several serve it, the deployment's --policy spreads across them | — |
Some shapes worth stealing:
// Burst to the cloud only when the local pool is full. First-match-wins does
// the work; there is no separate "spill" mechanism.
[{"position": 0, "max_inflight_per_backend": 2, "targets": ["local"]},
 {"position": 1,                                "targets": ["openrouter"]}]

// Let the client say what kind of work this is.
{"position": 0, "headers": {"x-fastllm-tier": "batch"}, "targets": ["cheap"]}

// Batch work (nobody is watching) goes somewhere slower.
{"position": 0, "stream": false, "targets": ["cheap"]}

// Degrade instead of refusing: past 80% of budget, use the free local model.
{"position": 0, "min_budget_used_percent": 80, "targets": ["local"]}

// Overnight, keep everything in-house. 22:00–06:00 local at UTC+2.
{"position": 0, "after": "22:00", "before": "06:00", "utc_offset_minutes": 120,
 "days": [1,2,3,4,5], "targets": ["local"]}
Failover. A rule's targets are tried in order. If the first model's whole
pool answers 5xx, 429, or cannot be reached, the request moves to the next
model in the same rule — before any byte has reached the client, so nothing is
corrupted. 429 counts because a hosted provider refusing a request is not
the same as being unhealthy: the pool passes every probe and still cannot serve
this call. When the chain is exhausted the last upstream's own status and body
reach the client rather than a synthetic 502.
Failover never widens reach: a candidate the caller lacks model:invoke on is
dropped from the chain, so a chain can span models with different grants
safely. Usage is attributed to the model that actually answered.
Malformed conditions ("after": "25:00", days: [8], a percentage above 100)
are rejected by POST /admin/frontend-models/{id}/rules with a message naming
the field, rather than stored as a rule that silently never matches.
Routing dry-run
POST /admin/routing/dry-run answers the question a rule author actually has —
"does my coding rule fire for this caller?" — without sending a real request
and reading the answer out of a log. It returns the candidate chain and the
index of the rule that decided, because "my second rule matched instead of my
first" and "my first rule matched and points somewhere I did not expect" are
different bugs with the same symptom.
A deny comes back as a denied object carrying the status and message the
caller would receive, with an empty chain — which is a different thing from
"nothing is serving", and the field is what tells them apart. A matching rule's
tag comes back too, so you can see what the usage row would be labelled.
Three honest limits, and the third is the one that bites.
Backend health is not consulted: the registry is built fresh from the
snapshot, so every backend looks up — GET /admin/fleet is where reachability
lives. The prompt class is supplied, not computed, so this tells you what a
coding prompt would do, not whether some particular prompt is coding —
POST /admin/prompt-classes/evaluate answers that one.
And max_inflight_per_backend cannot be evaluated here at all. The dry-run
runs on the control plane, whose registry has no in-flight counters and no
engine scrape, so every backend looks idle and a spill rule always reports as
still matching. A local-then-spill chain will therefore dry-run as "rule 0,
local" no matter how loaded the hardware is, while real traffic spills
correctly. Only real traffic exercises that condition; GET /admin/fleet and
the providers page show the live load the proxies are actually reading.
Authentication, sessions and TLS
How the admin plane authenticates humans, where the credentials live, and which listener has to be TLS.
Admin authentication
Every /admin/* route (including PUT /admin/principals/{id}/password below) requires a valid session cookie, checked by require_session in src/control/api.rs. POST /login verifies a {"name":..., "password":...} body against principals.password_hash (Argon2id — see src/control/auth.rs's doc comment for why this is a different hash from api_keys.hash's SHA-256, deliberately: a password is low-entropy and human-chosen, an API key or session token is high-entropy random) and, on success, sets fastllm_session (HttpOnly, SameSite=Strict, Secure when TLS is on) valid for 12 hours. POST /logout deletes the session and clears the cookie.
--proxy-token still gates /snapshot, /usage and /limits/reconcile — those are proxy processes authenticating to the control plane, not humans, and have no password to present; sessions and the proxy token are deliberately separate mechanisms for separate callers.
A session alone is not enough. require_session only establishes who is calling; every /admin/* handler additionally checks what that principal may do, via RequirePermission (src/control/api.rs), against the same roles → role_permissions → permissions model migrations/0001_init.sql seeds and the data-plane's own model:invoke authorisation already uses. A session with no matching permission gets 403, not 200 — a principal that can log in is not, by that fact alone, an administrator. This closes what was previously a real gap: any principal a password was ever set for (via PUT /admin/principals/{id}/password) was a full admin, because nothing checked further than "is this a valid session".
Every admin route needs one of four permissions, seeded by migrations/0001_init.sql:
| Permission | Routes |
|---|---|
usage:read | Every GET /admin/* route (keys, principals, models, frontend models, roles, limits, budgets, health) |
key:create | POST /admin/keys |
key:revoke | DELETE /admin/keys/{id} |
config:write | Every other write: principals (create/delete/roles/password), models, backends, frontend models, routing rules and targets, limits, budgets |
There is no finer-grained permission for "manage principals" or "manage frontend models" than config:write — the schema does not seed one, and inventing a permission per table would multiply roles for no operator-visible benefit. The built-in operator role holds everything except model:invoke (i.e. all four of the above); admin holds everything including model:invoke. A role with usage:read alone can list and view but never create, revoke or reconfigure anything — the shape a read-only UI viewer or an audit tool needs.
Bootstrapping the first login. A freshly migrated database has no session anyone can obtain — every principals row starts with password_hash IS NULL. Run this once, with the same database access import already requires:
fastllm-proxy set-password --name admin --password '...' --database-url postgres://...
Creates the named principal if it does not exist yet (as kind = 'user'), sets its password, and grants it the admin role unless it already holds one granting config:write — the one way to reach every config:write/key:create/key:revoke/usage:read route before any session-driven role grant is possible. Safe to run again later to reset a forgotten password. PUT /admin/principals/{id}/password (session-gated and config:write-gated, for every login after the first) does the same password-setting step through the admin API/UI once at least one session exists — deliberately behind config:write, not merely a session: it is the route that hands a principal a working login, so only a caller already trusted to reconfigure the system may grant one to somebody else.
Keep the admin port off the gateway's listener. A session cookie stops an anonymous request; it does not make a brute-forced password or a leaked cookie a non-issue, and the admin port also serves /snapshot, which returns decrypted upstream credentials to anything holding the proxy token. So the admin port must never share an address with the data plane, whose callers hold inference keys and have no business reaching it.
Whether it gets its own reachable address is a deployment decision about that network. deploy/control.yaml gives it one — a separate LoadBalancer on a pinned VIP, TLS-only, distinct from the gateway's — on the reasoning that the honest alternative was not "unreachable" but "every operator port-forwards first". On a network you do not control, bind it to a cluster-internal Service or localhost instead. Either way, it stays a separate Service from the proxy's.
Management UI
--role all/control serve a React dashboard from / and /ui/* (src/control/ui.rs; frontend source in web/). --role proxy serves no UI at all; control::api::serve, where the UI's fallback route is mounted, is never called for that role.
Sixteen screens, all driven by the admin API above: Overview (fleet, backends, traffic, recent changes), Metrics, Usage & spend, Providers, Models, Frontend models with the routing dry-run, Prompt classes with the leave-one-out evaluation, MCP servers, Agents, API keys, Principals & roles with the permission matrix and per-model grants, Limits & budgets, Audit log, Fleet, and Settings. A seventeenth, Deployment, appears only when a FastllmProxy manages this process — it edits the resource rather than the database, so it is absent from every other install and its routes 404 there.
Nothing on a screen is invented. Where the control plane cannot answer a question, the UI says so and names what can: per-backend latency percentiles are per process and do not merge, so the Metrics screen prints the histogram_quantile query rather than an average of p99s; a model with no price shows unpriced, never $0.00; a backend no replica has probed shows a grey dot, not a green one. The rule is the same one the docs follow — a number nobody can reproduce is worse than an absent one.
The one thing that is computed in the browser is a rate: the control plane stores no metric history, so every line on the Metrics screen is a delta between two polls of the counters the fleet reports, starting empty when the page loads. The header says so on the page.
Three checks guard it, all under web/, run by npm test and by CI's ui job on every commit. The Dockerfile's web stage deliberately does not run them a second time — see the comment there.
test/render.mjsmounts every screen against stubbed responses and fails on a render error or missing content.npm run buildproves the modules parse; it says nothing about whether a screen renders, and a component used but not imported is a clean build and a blank page.test/interact.mjsclicks every control on every screen (231 of them) and then asserts the exact method, path and body that the important mutations send. This exists because the worst bug this UI has had was a screen that rendered perfectly while posting{position, match_condition: {...}}to a handler that flattens the conditions — serde discarded them, answered 201, and every rule created through the UI matched every request. Nothing looked wrong; only the request body was, and no test had ever looked at one.test/browser.mjs(npm run test:browser, needs a running control plane) drives the built bundle in headless Chrome: a real login, every screen, the dry-run against the live routing engine, and a second pass at 1280px. jsdom does no layout at all — every element is zero by zero and nothing can overlap — so the entire visual half of the UI was unverified by the two harnesses above. This one checks what only a browser knows: console errors, failed requests, sideways page scroll, zero-size or clipped controls, text overflowing its box. It writes a screenshot per screen toweb/.screenshots/to be looked at, and launches Chrome with its own--user-data-dirso it never touches a browser already open.test/verify-fixtures.mjs(npm run test:fixtures, needs a reachable control plane) compares the fixtures against a live API. Both harnesses are only as truthful as their fixtures, and twice a fixture written from the Rust field name rather than the wire format hid a real bug while the suite stayed green — the flatten above, andmodel:invokewith resource*where the API storesmodel/*.
Embedded into the binary with rust-embed reading web/dist/ at compile time — one container image, no second artefact to deploy. Built by the Dockerfile's dedicated node stage, not a build.rs that shells out to npm, so cargo build/cargo test never require Node — a web/dist/ empty at compile time (the normal state outside the Docker build) degrades to a plain "UI not available" response rather than failing the build. See web/dist/.gitkeep's neighbour, src/control/ui.rs's module doc comment, for the full mechanics.
Encryption at rest
providers.upstream_api_key is encrypted at rest with AES-256-GCM (src/control/secrets.rs; ring::aead, already in the dependency tree via rustls) before import/the admin API ever write it to Postgres, and decrypted by build_snapshot when the control plane builds a snapshot. This protects the database, not the snapshot: /snapshot still carries the credential in usable plaintext form, because the proxy has to present it to the backend as a bearer token — an upstream credential cannot be reduced to a hash the way api_keys.hash is. /snapshot must be TLS wherever a backend has a real credential, exactly as before this existed. What encryption at rest actually buys: someone with read access to Postgres (a backup, a replica, a leaked pg_dump) no longer gets every upstream credential for free.
--role control/all and fastllm-proxy import/reencrypt-backends all require FASTLLM_ENCRYPTION_KEY — 32 bytes, hex-encoded (e.g. openssl rand -hex 32) — and refuse to start without it rather than falling back to plaintext. --role proxy never touches the database and never requires it. A database that already has plaintext rows from before this existed needs the one-shot fastllm-proxy reencrypt-backends --database-url <url> command run once; see migrations/0004_encrypted_upstream_api_key.sql for why this is a command rather than a format the read path silently tolerates forever.
TLS on /snapshot and /usage
/snapshot carries providers.upstream_api_key in usable plaintext form (see "Encryption at rest" above), so it — and /usage, gated by the same token and sharing the same listener — must be TLS in any deployment where a backend has a real credential.
--role control/all take --tls-cert/--tls-key (PEM, FASTLLM_TLS_CERT/FASTLLM_TLS_KEY). Give both and the admin API — /admin/*, /snapshot, /usage, all of it, since they share one listener — serves HTTPS via rustls/tokio-rustls (already dependencies; no new TLS crate). Give neither and it serves plain HTTP, logging a startup warning every time it does, because a dev deployment with no real backend credentials is legitimate and must not be forced to generate a cert it does not need — but the fallback must never be silent. Giving only one of the two is a startup error, not a silent fall-back to HTTP.
On the client side, --role proxy in Http mode (--control-url https://...) and any https:// backend api_base both go through the one pooled Upstream client (src/upstream.rs), which already speaks TLS. --ca-bundle (FASTLLM_CA_BUNDLE) adds one or more PEM CA certificates to the trust store in addition to the system roots — required to trust a private or self-signed cert (a cert-manager-issued, in-cluster control-plane certificate is the normal case; see deploy/control.yaml's fastllm-control-tls Certificate and deploy/README.md's TLS section) that no public root store contains. Without it, --control-url https://... against such a cert fails the handshake.
The control-plane protocol
The channels a proxy uses to talk back to its control plane — usage, health reports, budgets and rate-limit reconciliation.
POST /usage: the reverse channel
--role proxy holds a usage::UsageReporter: a bounded queue plus a background flush task that batches events and posts them to /usage on its own schedule, authenticated with the same --proxy-token as /snapshot. Recording an event (UsageReporter::record) is a non-blocking try_send — a full queue means the control plane is not keeping up, and the event is dropped rather than applying backpressure to inference (the design's stated tradeoff: "dropping usage rather than blocking a request is deliberate — billing accuracy is not worth failing inference"). Dropped events are counted and exposed on /metrics as fastllm_usage_reports_dropped_total, so the loss is visible instead of silent. --role all loops this same request back to its own admin API over 127.0.0.1 rather than inventing a second, in-process delivery path.
On the control-plane side, POST /usage accepts a batch, persists it to usage_events, and folds each event's tokens into its principal's budgets.tokens_used, if that principal has a configured budget. A record naming a principal_id or model that no longer exists is dropped from the batch rather than failing the whole request — one stale id from one replica must not poison every other principal's usage in the same flush interval.
POST /health-report: the same channel, one more fact
--role proxy/all also post a health report every --health-report-interval
(FASTLLM_HEALTH_REPORT_INTERVAL, default 10s) on that same --proxy-token
channel, read back by GET /admin/fleet (see "Live backend health" above).
Same posture as usage: a bounded queue — depth one, since only the newest
report says anything true — and a failed delivery is dropped rather than
retried or allowed to block anything. --role all loops it back over
127.0.0.1 exactly as usage does.
P3: usage accounting and budgets
The proxy never parses response bodies — that is its whole performance story — but usage lives in the body, so this is the one place that comes under tension. The resolution:
-
Getting the numbers. A non-streaming response already carries a top-level
usageobject. A streaming one only does if the request setstream_options.include_usage, sosrc/proxy.rs'srewrite_model_if_neededinjects that field into the upstream body, reusing the same body-rewrite path that already exists for model aliases. This happens for every attributable request — any request with a principal (principal_needs_usage). Only an unauthenticated request is exempt, because there is nobody to attribute the consumption to.This was once restricted to principals with a configured budget or a
tokens_per_minlimit, on the reasoning that nothing else read the number and the injection adds a usage chunk the client did not ask for. That made accounting a side effect of enforcement, and a deployment enforcing nothing recorded nothing: on the cluster where it was found, one principal of seven had a budget,usage_eventsheld nineteen rows, and the newest was five days old while the gateway had served hundreds of requests. Consumption is worth knowing whether or not a cap is attached to it, and it cannot be recovered later — the counts live in a response body that is forwarded and gone. -
Reading them without becoming a parser.
src/tail_buffer.rs'sTailBufferkeeps a fixed-size (8 KiB) ring of the last bytes forwarded —TrackedBody::poll_frameinsrc/proxy.rsmirrors every frame into it with a memcpy, never a parse, alongside the pass-through that already exists. At clean end of stream, and only then, the tail is parsed once for a trailingusageobject (streaming SSE or non-streaming JSON, tried in that order). The parser reads both OpenAI's spellings (prompt_tokens/completion_tokens) and Anthropic's (input_tokens/output_tokens), because a native Anthropic response forwarded verbatim uses the latter. One case the tail cannot cover on its own: a native Anthropic stream reportsinput_tokensinmessage_start, the first event, which a long generation evicts from any tail — so that path also runsprotocol::anthropic::StreamUsage, an event-wise mirror whose counts take precedence at finish. -
A row per backend response, whether or not the counts were found. Finding nothing is an ordinary outcome, not an error, and the event is recorded either way with
usage_reported = false. That flag is load-bearing in two directions. It is what makes request rate answerable fromusage_eventsat all — a backend that answers 5xx carries no usage block, so recording only responses that had one dropped exactly the rows that describe failure. And it keeps the totals honest: zero tokens and unknown tokens are different facts, so an unreported row prices toNULLrather than to a confident$0.00that would read as priced-and-free. A response larger than the buffer, or a stream that ends mid-frame, still costs exactly one bounded parse and never panics. -
Requests the gateway refuses are recorded separately. The usual row is written by the body that forwards the response, and a refused request has no such body, so
proxy::record_refusalwrites one directly for 403 (authorisation), 429 (rate_limit), 402 (budget) and the synthesised 502 for an unreachable chain (no_backend). Therefusalcolumn is NULL for everything a backend answered, which is what lets a chart separate the two:statusalone cannot tell a 502 the proxy synthesised from a 502 an upstream returned.no_backendis the case that forced this — with every backend down nothing is forwarded, so before it a total outage wrote no rows and an error chart read a flat zero. -
Unauthenticated 401s and unknown-model 404s are counted, not rowed. They have no principal to attribute and no model to name, and 401 is the one refusal an anonymous caller can trigger at will — a row apiece would let unauthenticated traffic drive unbounded writes. They are aggregated per replica per minute in
gateway_rejections, fed by the counters on the health report the proxies already send, and surfaced asrefused_unattributedonGET /admin/timeseries. Excluded when filtering by model or principal, since they belong to neither. This means a caller-visible error total is answerable from Postgres alone — it is simply two tables, because the two kinds of failure are shaped differently. Seedocs/operations.mdfor the delta handling and the restart case. -
Enforcement is after the fact.
Principal.budgetis pre-resolved into the snapshot (control::build::roll_over_and_load_budgets), so the request path's check is one integer comparison, no I/O — the same shape as the rate limiter just above it. A request that pushes a principal over budget still completes; the next one is refused, with 402 Payment Required, not 429: rate limiting (429) is a pacing problem where waiting a few seconds fixes it, andRetry-Aftersays how long; a budget is a spending problem where no amount of waiting helps until the window rolls over or an operator raises the limit, which is what 402's stated meaning — access denied pending an accounting action — actually matches. -
Budgets roll over.
daily/weekly/monthly(fixed-length — 1/7/30 days, not calendar-month arithmetic) checked on every snapshot rebuild; an elapsed window resetstokens_usedto zero and persists the newwindow_start, advancing exactly one window forward even if several were missed while nobody looked.
Rate limits
Limits attach to a principal, not a key: requests_per_min and tokens_per_min, either or both, set via PUT /admin/principals/{id}/limits (or, in File mode, a limits: block under an auth.keys entry — see "Per-key RBAC in File mode" below). A principal with no configured limit is unlimited, not limited to zero.
Enforcement is a local token bucket per principal per replica (src/limiter.rs): one hash lookup and a short, synchronous decrement, no I/O, no allocation once the principal's bucket exists. tokens_per_min is charged against an estimate — the same prompt-size estimate the P1 routing rules use, plus the client's requested max_tokens — since actual usage is not known until the response completes. Exceeding either dimension answers 429 with Retry-After (whole seconds).
A single replica enforcing the full configured limit locally would, with N replicas, admit N× the intended traffic. Accuracy comes from periodic reconciliation instead of a shared counter: every --rate-limit-reconcile-interval seconds (default 5) each --role proxy reports its locally observed request/token counts to POST /limits/reconcile, which aggregates across every replica that has reported recently and returns each one's share — proportional to how much of a principal's traffic it is actually handling — of that principal's configured limit for the next window. The reporting client (src/reconcile.rs) reuses the same pooled Upstream client and bearer-token pattern as POST /usage, but it is not fire-and-forget like that route: the whole point is the allowance in the response body. Before a replica's first successful reconciliation (at startup, or after a control-plane outage) it enforces the full configured limit locally, which is the design's accepted cost: a limit can be exceeded by up to one reconciliation window's worth of traffic during a sharp spike, in exchange for never putting a network round trip on the request path.
--role all never spawns the reconciliation client at all — one process's local counters already are the global counters, so there is nothing to reconcile, and the machinery is inert rather than merely harmless: no background task, no timer, no socket.
Architecture
Keep this current. Per CLAUDE.md, a change that adds a component, a role, an
endpoint crossing a plane boundary, or alters how the snapshot moves makes
these diagrams wrong, and redrawing them is part of that change's commit.
The two planes
One binary, three roles. The split between management and forwarding is a runtime flag, not a deployment boundary, so the same image is a single container in a lab and a scaled deployment in Kubernetes.
flowchart LR
    client([OpenAI client])
    aclient([Anthropic client<br/>Claude Code, SDKs])

    subgraph dp["Data plane — --role proxy"]
        msgs["/v1/messages<br/>Anthropic ⇄ OpenAI shape"]
        auth[authenticate + authorise]
        classify["classify prompt<br/>(only if classes exist)"]
        route[resolve model, evaluate rules]
        limit[rate limit + budget check]
        fwd[forward opaque bytes]
        xlate["translate<br/>(native protocols only)"]
        snap[(Snapshot<br/>in memory)]
        cache[(last-known-good<br/>on disk)]
    end

    subgraph cp["Control plane — --role control"]
        admin["admin API + UI<br/>session auth, per-route permissions"]
        fleetstore[("fleet health<br/>in memory, 30s TTL")]
        build[build snapshot]
        pg[(Postgres)]
    end

    backend([vLLM / SGLang / OpenRouter<br/>/ any OpenAI-compatible])

    client -->|"Bearer sk-…"| auth --> route --> limit --> fwd --> backend
    aclient -->|"x-api-key"| msgs -->|"chat completion"| auth
    fwd -.->|"response translated back"| msgs
    limit -.->|"backend.protocol ≠ openai"| xlate
    xlate -.-> native([Anthropic / Gemini<br/>native API])
    auth -.reads.-> snap
    route -.reads.-> snap
    limit -.reads.-> snap

    admin --> pg
    build --> pg
    build -->|publishes| admin
    snap <-->|"GET /snapshot (TLS, ETag)"| admin
    snap -.writes.-> cache
    cache -.restores on cold start.-> snap
    fwd -->|"POST /usage (batched)"| admin
    health["backend health<br/>probes + in-flight counts"] -->|"POST /health-report (every 10s)"| admin
    admin --> fleetstore
    fwd -.observed by.-> health
    engines["engine load<br/>GET /metrics (every 2s)"] -.reads.-> route
--role all runs both boxes in one process; the snapshot is handed over in
memory instead of over HTTP, and the rate-limit reconciliation machinery is
inert because one process's counters are already global.
Why a snapshot, and why it is pre-flattened
The request path must do no I/O — the proxy's measured overhead against a real vLLM is zero, and a database round trip per request would cost more than the proxying itself. So every expensive question is answered once, when the snapshot is built, never per request:
flowchart TD
    r[roles] --> p[permissions]
    p --> w["wildcards expanded<br/>model/* → allow_all"]
    w --> flat["Principal.allowed_models<br/>(a flat HashSet)"]
    flat --> ask["request path:<br/>one set lookup"]
Per request that leaves: one SHA-256 of the bearer token, one hash lookup to a
principal, an expiry comparison, one set lookup for the model, and — when the
principal has a limit — an RwLock read plus up to two short mutex-guarded
bucket operations. No graph walk, no I/O, no lock held across an await, no
allocation beyond what the body already needed.
The Anthropic frontend
POST /v1/messages (src/protocol/messages.rs) faces the client rather than
the backend. The request is translated to a chat completion and handed to the
same proxy_request every other call uses, so routing, cache affinity,
budgets, rate limits and RBAC are not reimplemented and cannot drift; the
answer, streamed or not, is translated back to Anthropic's shape. x-api-key
is moved to Authorization before authentication.
When the routed backend itself speaks Anthropic, the translation stops at the
frontend: proxy_request holds the client's original bytes and forwards those
verbatim (model alias and auth aside), marked so the answer is handed back
without the OpenAI→Anthropic conversion. This is not an optimisation — a
twice-translated body has lost metadata, the per-block cache_control
markers and the client's key order, and that loss is exactly what an upstream
that fingerprints coding-agent traffic (Z.ai's coding plan, for one) detects
and refuses.
Known limits, because a translator should say what it does not do: thinking
blocks are dropped in both directions on the translated path (the native
passthrough has none), count_tokens is an estimate, and only
/chat/completions is translated — the other proxied suffixes are 501 on a
native-protocol backend.
Three execution modes
The dotted branch above is the whole of multi-provider support, and it is drawn dotted on purpose: it is not on the default path.
passthrough (protocol = openai) | native (anthropic backend behind /v1/messages) | translated (anthropic, gemini) | |
|---|---|---|---|
| request body | forwarded as-is, or one splice for a model alias | the client's own bytes, model alias aside | parsed and re-serialised into the native shape |
| response body | never parsed; forwarded byte for byte | forwarded byte for byte | parsed, re-framed into OpenAI chunks |
| usage | bounded tail buffer, one parse at end of stream | tail buffer plus a head-of-stream scanner | already parsed, exactly, during translation |
| endpoints | all seven proxied suffixes | /v1/messages only | /chat/completions only; the rest are 501 |
The native mode exists for the same fidelity reason as the passthrough — the
client's request reaches the provider exactly as the client built it — with
one addition the OpenAI case does not have: an Anthropic stream reports
input_tokens in its first event, which no bounded tail can hold, so
StreamUsage (src/protocol/anthropic.rs) mirrors the stream event-wise for
accounting while the bytes themselves go straight through.
| tool calling | passthrough, untouched | translated both directions, streaming included |
| image/audio input | passthrough, untouched | data: URLs translated inline; never fetched |
| overhead | zero measured against a real vLLM | one parse per frame |
Most providers are the left column, including OpenRouter — which is why
"support every provider genai supports" is mostly a configuration exercise
and not a code one. Only Anthropic and Gemini, addressed directly rather than
through an OpenAI-compatible gateway, are the right column.
The boundary is enforced, not merely intended: tests/native_protocols.rs
sends an intentionally odd-but-valid JSON document (unusual whitespace, key
order no serializer of ours would emit, a field we have no struct for) through
an openai backend and asserts the client receives those exact bytes. Any
accidental round trip through a parse shows up as a diff.
A request, end to end
sequenceDiagram
    participant C as Client
    participant P as Proxy
    participant B as Backend
    participant K as Control plane

    C->>P: POST /v1/chat/completions
    P->>P: SHA-256 → principal (401 if unknown/expired)
    P->>P: classify prompt — only when classes are configured
    P->>P: resolve model — frontend models evaluate rules, producing a fallback chain
    P->>P: authorise the name the caller used (403 if ungranted)
    P->>P: rate limit (429) and budget (402)
    P->>P: translate request — only if backend.protocol ≠ openai
    P->>B: forward, original bytes (or the translated ones)
    B-->>P: 429/5xx → next backend, then the next model in the chain
    B-->>P: response frames
    P-->>C: same frames, never parsed
    Note over P: tail buffer mirrors the last few KB
    P->>P: at end of stream, parse once for usage
    P-)K: POST /usage (batched, fire-and-forget)
    K->>K: fold into budgets.tokens_used
    P-)K: POST /health-report (every 10s, out of band)
Two decisions in that flow are load-bearing:
-
Authorisation is checked against the name the caller used. A request naming a frontend model is authorised against that frontend model; one naming a provider model directly is authorised against the provider model. A frontend model is how a model is exposed, so it is what gets granted — and a grant on it covers the chain it routes to, rather than being filtered per target. Adding a target to a frontend model therefore extends the reach of everyone holding it, which is acceptable only because editing one requires
config:write, itself all-or-nothing and already sufficient to grant any model outright. It is not a skeleton key: a provider model named directly still needs its own grant.This reversed the earlier rule, which required a grant on the resolved provider model. That rule pinned every grant to a provider model's name, so renaming one revoked access silently — migration 0029 did exactly that in production. See
.procoder/adr/0002-authorisation-moves-to-the-frontend-model.md.The "served here" check runs before authorisation, so an unknown model is a 404 for everyone and 403-vs-404 cannot be used to probe what exists.
-
Usage is read from a fixed-size tail buffer, parsed once at the end — never per frame. The response is still forwarded as opaque bytes. A translated response is the exception in the cheaper direction: its token counts were already parsed exactly, so it carries no tail buffer at all.
Administrative permissions
Admin routes are gated by a session and a per-route permission, drawn from
the same roles → permissions model the inference side uses: usage:read for
reads, key:create and key:revoke for key lifecycle, config:write for
everything else.
Two things an operator should know rather than discover:
config:writeis effectively administrative. A principal holding it can grant itself roles throughPOST /admin/principals/{id}/roles, sokey:create/key:revokeare a separation of duties, not a security boundary against it.- The
/admin/*404 for an unknown path is served outside the session gate, so an anonymous caller can tell which admin paths are not routes. It discloses no data, only the shape of the API.
Failure modes
| event | behaviour |
|---|---|
| control plane down, proxy warm | serves from memory; policy stops changing |
| control plane down, proxy cold | loads last-known-good from disk |
| cold start, no cache | starts, /health unhealthy, never crash-loops |
| snapshot invalid | keeps the previous one, logs once |
| key revoked | effective within the poll interval, ~1s |
| a model in a chain returns 429/5xx | the next model in the same rule serves it; nothing reached the client yet |
| every model in the chain refuses | the last upstream's own status and body are forwarded, not a synthetic 502 |
| one replica cannot reach a backend the rest can | the fleet's tally, returned in the reply to that replica's health report, contradicts it; the replica withdraws its own ejection and lets its next probe decide again |
| one replica genuinely is the only one that cannot | it hands the request to a sibling that can, one hop only; readiness cannot express "blind for one model" so the replica stays in rotation and this is what keeps it honest |
| Postgres down | control plane serves its last built snapshot; proxies unaffected |
| SIGTERM (a rollout) | stops accepting, lets in-flight generations finish, exits — up to --shutdown-grace (25s, under Kubernetes' 30s default) |
| usage report fails | dropped; never blocks a request |
| health report fails | dropped, logged at debug; GET /admin/fleet ages that replica out after 30s |
| upstream speaks an unexpected shape | translated backends only: the body fails rather than returning a plausible empty completion |
| snapshot names an unknown protocol | that backend is dropped with a logged reason, never silently treated as OpenAI |
Never crash-looping on a cold start is deliberate: under Kubernetes that would turn a control-plane outage into a data-plane outage, which is the failure this split exists to prevent.
Consistency, stated honestly
- Budgets are enforced after the fact. A request that blows the budget completes; the next is refused. Counting mid-stream would mean parsing every frame.
- Rate limits can overshoot by up to one reconciliation window during a sharp spike, because replicas enforce locally and reconcile periodically rather than sharing a counter on the request path.
- A replica with no recent traffic for a principal keeps a floor of
1/replicasof that principal's limit. Without it an idle replica's computed share collapses to zero and it refuses every request while the principal is far under budget — a worse failure than over-admitting. The floor bounds total allocation at under 2x the configured limit in the worst case (one busy replica, the rest idle), never more. - Policy changes propagate within one snapshot poll, not instantly.
- Semantic classification is deterministic and costs nothing when unused. With no prompt classes configured it is one atomic load and a length check. With classes, the fast tier is ~115µs of pure CPU; the refined tier is loaded only if some rule names a class that refines a fast-tier one, so a deployment that does not use it cannot pay for it. See semantic routing.
- Load balancing is an object, not a setting. A model pool is a named group of provider models with one policy; a rule points at it as a single target. That splits three questions that were previously tangled in one control: the order to try things in (a rule's targets), which of several models serves (a pool), and which of a model's own providers serves (the provider model). Each is set in exactly one place, and a pool is reusable across rules — which a policy attached to one rule's target list could never be.
- Every routing rule is terminal. A rule that matches decides everything
about the request — route it, refuse it, or delegate the whole decision to
another frontend model's chain. Firewalls have non-terminating rules that
mark and continue; that is deliberately not copied, because "first match
wins and the matching rule decided" is what lets
/admin/routing/dry-runanswer with one rule name rather than a trace. Modifiers (a usagetag, a target-selectionpolicy) are fields on a routing rule, never separate passes. - Two routing conditions are deliberately non-deterministic.
max_inflight_per_backendreads live in-flight counters — the engine's own, scraped from its Prometheus/metricsby each proxy in the background, so the ceiling means the same thing however many proxies are running, falling back to this replica's count for a backend that publishes none (which is detected by asking, not configured) — and the time-window conditions read the clock, so identical requests can route differently and prefix affinity stops applying to the traffic they divert. Every other condition is a pure function of the request. This is the same opt-in-visibly line the passthrough/translate split draws. - The queue forms in the proxy, not in the engine (flow control, set per
backend on the
model_backendsrow; seedocs/operations/configuration.md). vLLM accepts everything and queues the surplus itself, unbounded, which makes every request slow rather than failing any. A backend with a gate carries it in the snapshot like any other backend setting; the proxy's engine scraper halves the gate's ceiling while the engine'snum_requests_waitingsits at or above its high-water mark, and grows it by one per scrape once the queue drains. Requests past the ceiling wait in the proxy, bounded, and are refused with 503 andRetry-Afterbeyond that. The request path only awaits a semaphore, so it still performs no I/O. Each replica holds its own ceiling -- sharing it would mean a network round trip per request -- and the engine's queue depth, which already reflects every replica's traffic, is what keeps them honest. Each gate's state rides the existing health report to the control plane, which is how the Fleet and Models pages show it.
Behaviour notes
- Retries only happen before any byte has been forwarded. Once the response is committed a mid-stream failure propagates as-is — it cannot be silently retried without corrupting the stream.
- 5xx is retried, 4xx is not. A client error retried across every node is the same client error three times.
- The last backend's response is forwarded verbatim. A 5xx is only retried while another backend remains; when none does, the upstream's own status and body reach the client rather than a synthetic 502. On a single-node pool that means every error keeps the engine's diagnostics.
- Audio endpoints take
multipart/form-data.modelis read from the form field and the upload is forwarded byte for byte, content-type and boundary intact. An alias splices the new name into that one field rather than re-encoding the body. https://backends work, so a TLS-terminated or hosted endpoint can sit in the same config as cluster-local nodes. System root certificates are used, falling back to the bundled Mozilla set.- When every backend in a model is unhealthy, the request skips to the next model or the deployment-wide fallback rather than sending to a known-failed node.
tests/failover.rsverifies the end-to-end behaviour. - The client's
Authorizationheader is never forwarded. It authenticates the client to the proxy; the upstream gets the backend's own key or none — in whichever header that provider reads it from. - An OpenAI-compatible backend's response is never parsed. Bytes are forwarded verbatim, which is why proxied overhead measures at zero;
tests/native_protocols.rspins it against an intentionally odd-but-valid payload. Only a backend explicitly configured for a native protocol is translated, and only there is a response body read. - A backend's identity covers its whole configuration. Rotating an upstream key, or changing a backend's protocol, produces a new routing entry rather than reusing the live one — otherwise a reload would keep serving with the old credential, since backend objects are carried across reloads to preserve their in-flight counts.
- Affinity keys hash the raw request prefix, not parsed fields. JSON does not guarantee field order, but order is stable per client, which is all affinity needs — a client that reorders per request degrades to least-loaded rather than misrouting.
- A rate-limited request gets
429withRetry-After, checked after authorisation and model resolution but before the request is dispatched upstream — nothing is forwarded on a rejected request. See "Rate limits" above.
Semantic routing
Route on what a prompt is about, not on a header the client had to set.
In this section
| Setting it up | Classes, tiers, the leave-one-out evaluation, and naming a class in a rule |
| What it costs | Two tiers and why, what separates and what does not, and the production numbers |
Setting up semantic routing
Define a class, check it separates, then name it in a rule.
Status: shipped, behind the classifier cargo feature and a
--classifier-model pointing at the model — the Docker image bakes one in and
sets it, so it works out of the box there.
Define a class with example prompts, then name it in a routing rule:
curl -X POST https://control/admin/prompt-classes -b "$SESSION" \
  -H 'content-type: application/json' \
  -d '{"name":"coding","min_margin":0.05,
       "examples":["Why does this Rust code fail the borrow checker?",
                   "My unit test throws NullPointerException on line 42."]}'
{ "position": 0, "class": "coding", "targets": ["claude-sonnet"] }
POST /admin/prompt-classes/evaluate reports, per class, leave-one-out
precision and recall over your own examples, the mean and worst margin, the
nearest other classes, the examples that were misclassified, and a verdict.
Two classes whose centroids sit above ~0.8 are one region with two names and no
threshold separates them — the report says so rather than leaving you to infer
it from four numbers.
Defining a class
Everything above is a screen, and Prompt classes is where a class begins. A name, a tier, and example prompts one per line — no training step and no model to fit. Create it, and the control plane averages the examples into a centroid on its next rebuild.
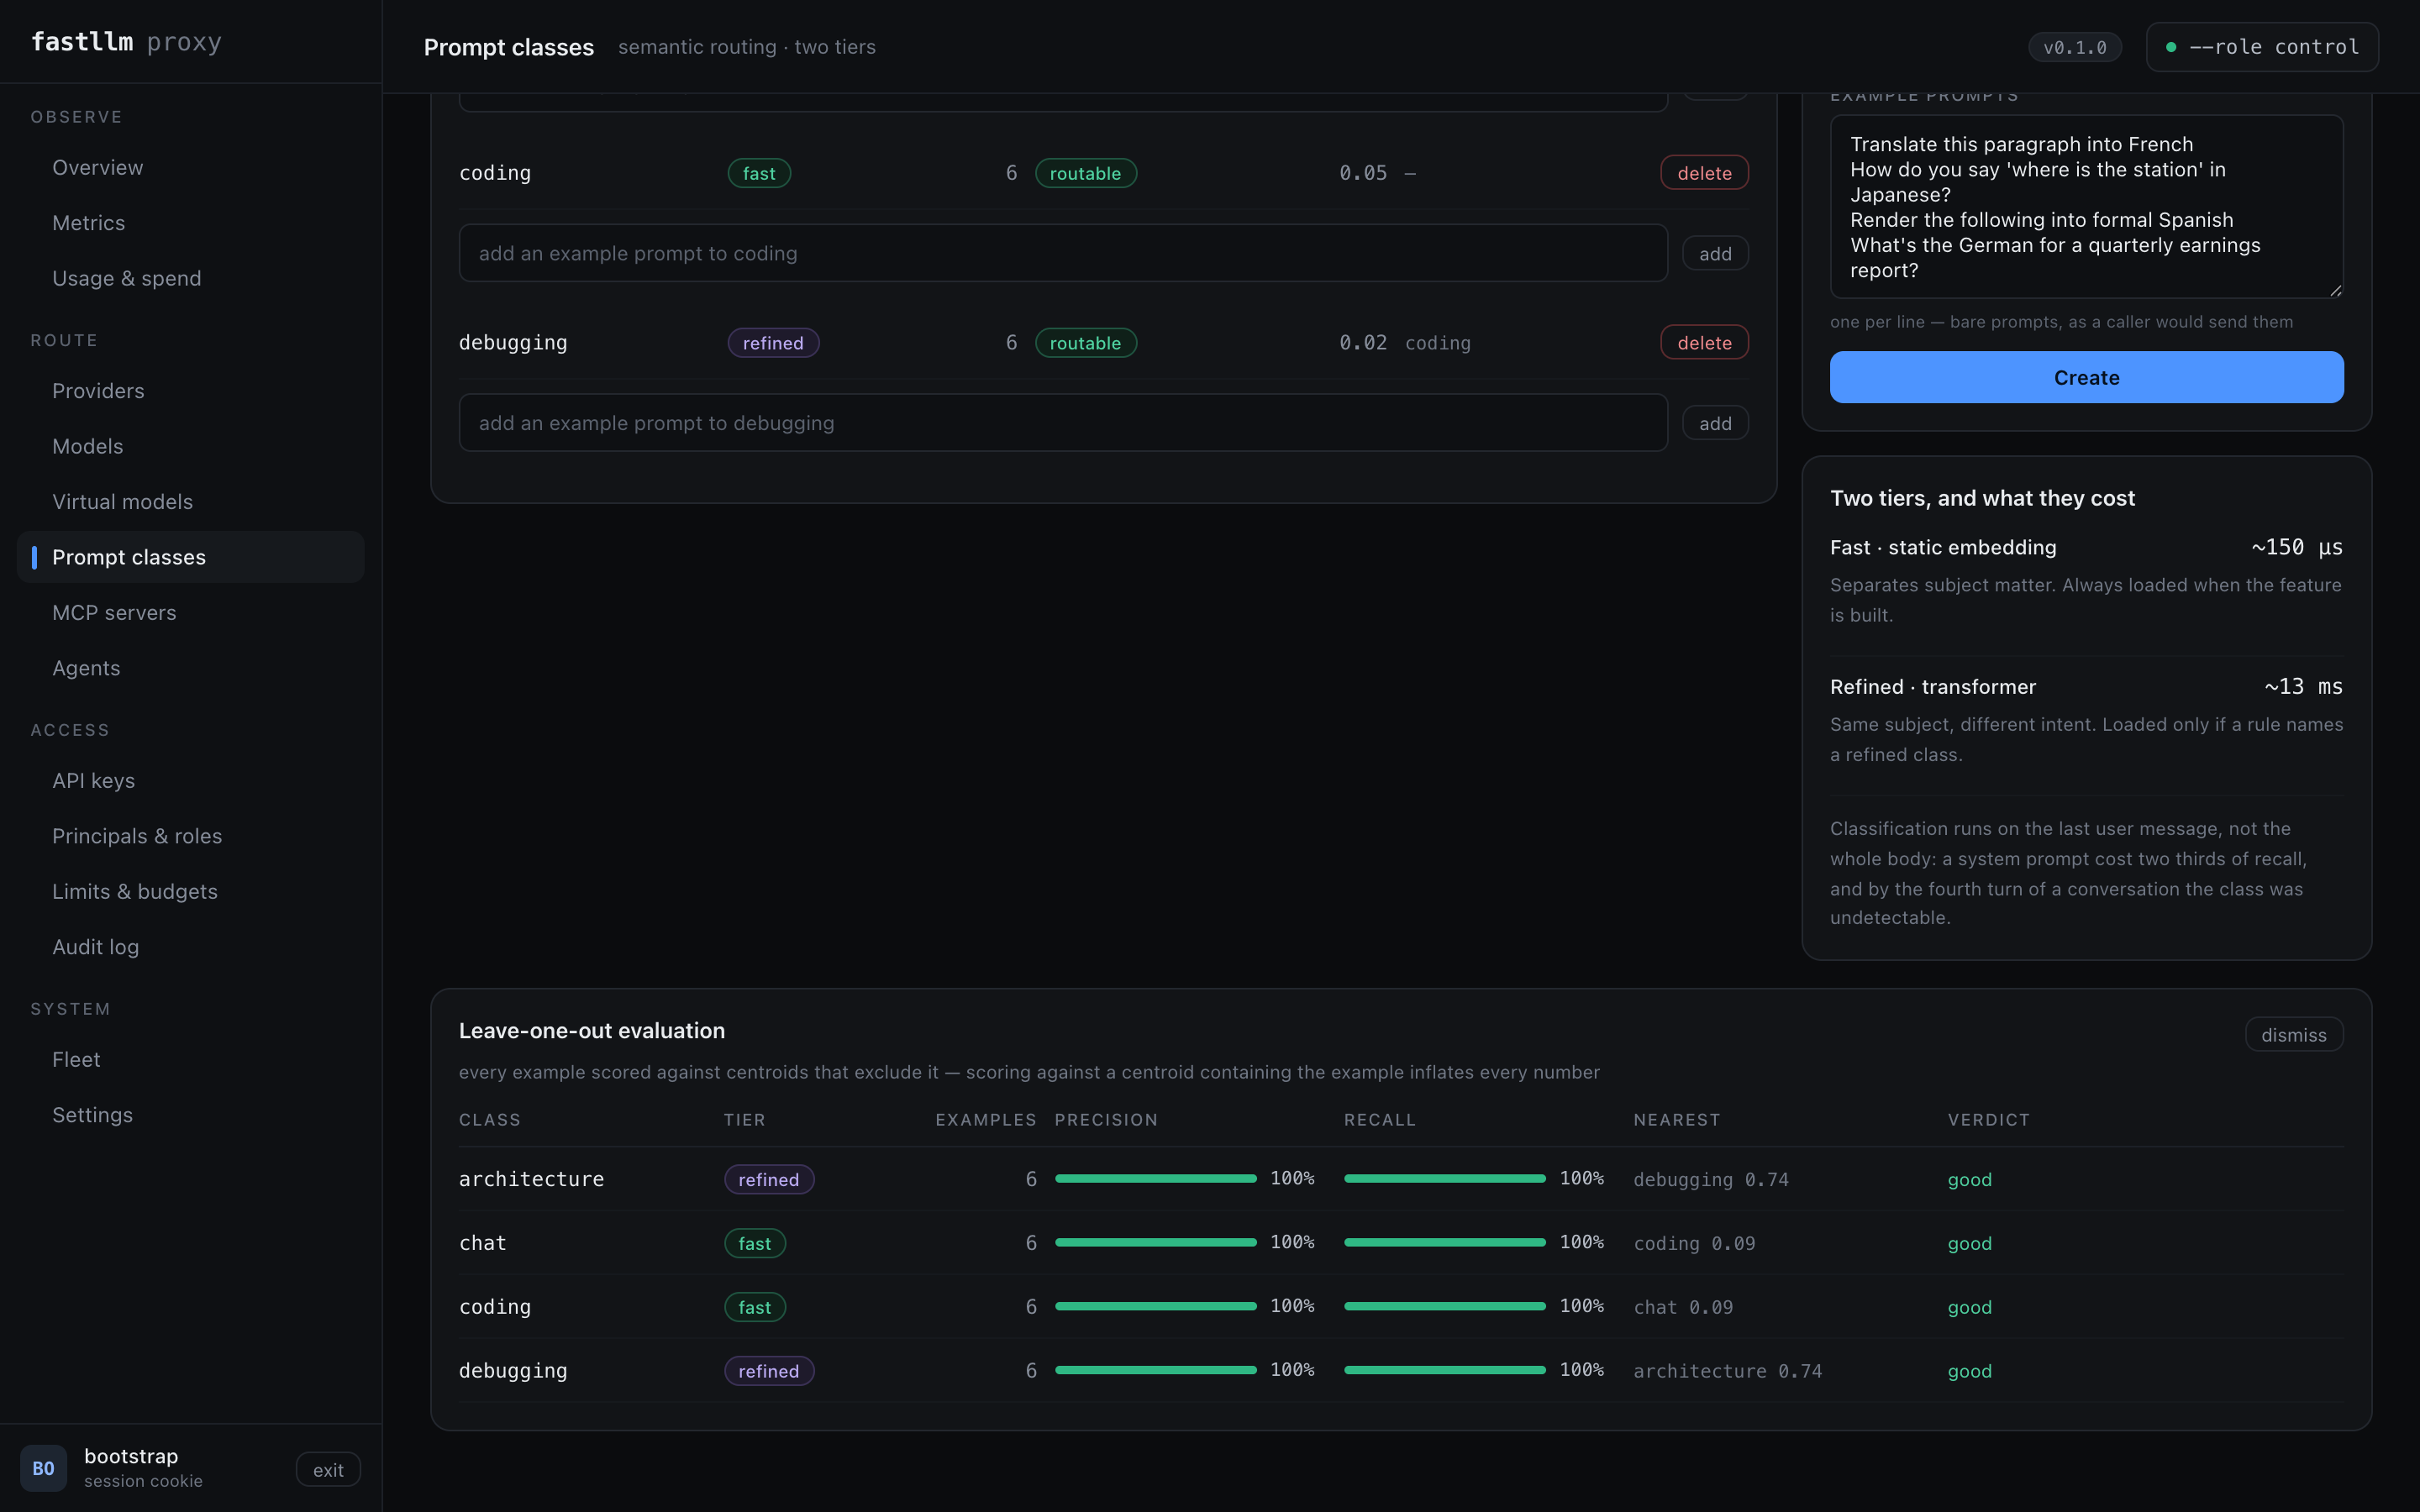
The tier selector is the decision worth pausing on, and the panel beside
the form states its price: fast costs ~150 µs and is always loaded; refined
costs ~13 ms and loads a transformer, but only if some rule actually names a
refined class. Choose fast unless you need to separate two things that share
a subject — debugging from coding, say — which is exactly what the refined
tier is for.
The table's routable column is the one that saves an afternoon. A class with examples but no centroid cannot match, so a rule naming it silently never fires — which looks identical to a rule that is simply not being hit. The screen calls it out rather than leaving you to infer it.
Check the classes before you route on them
Run evaluation scores every example against centroids that exclude it:
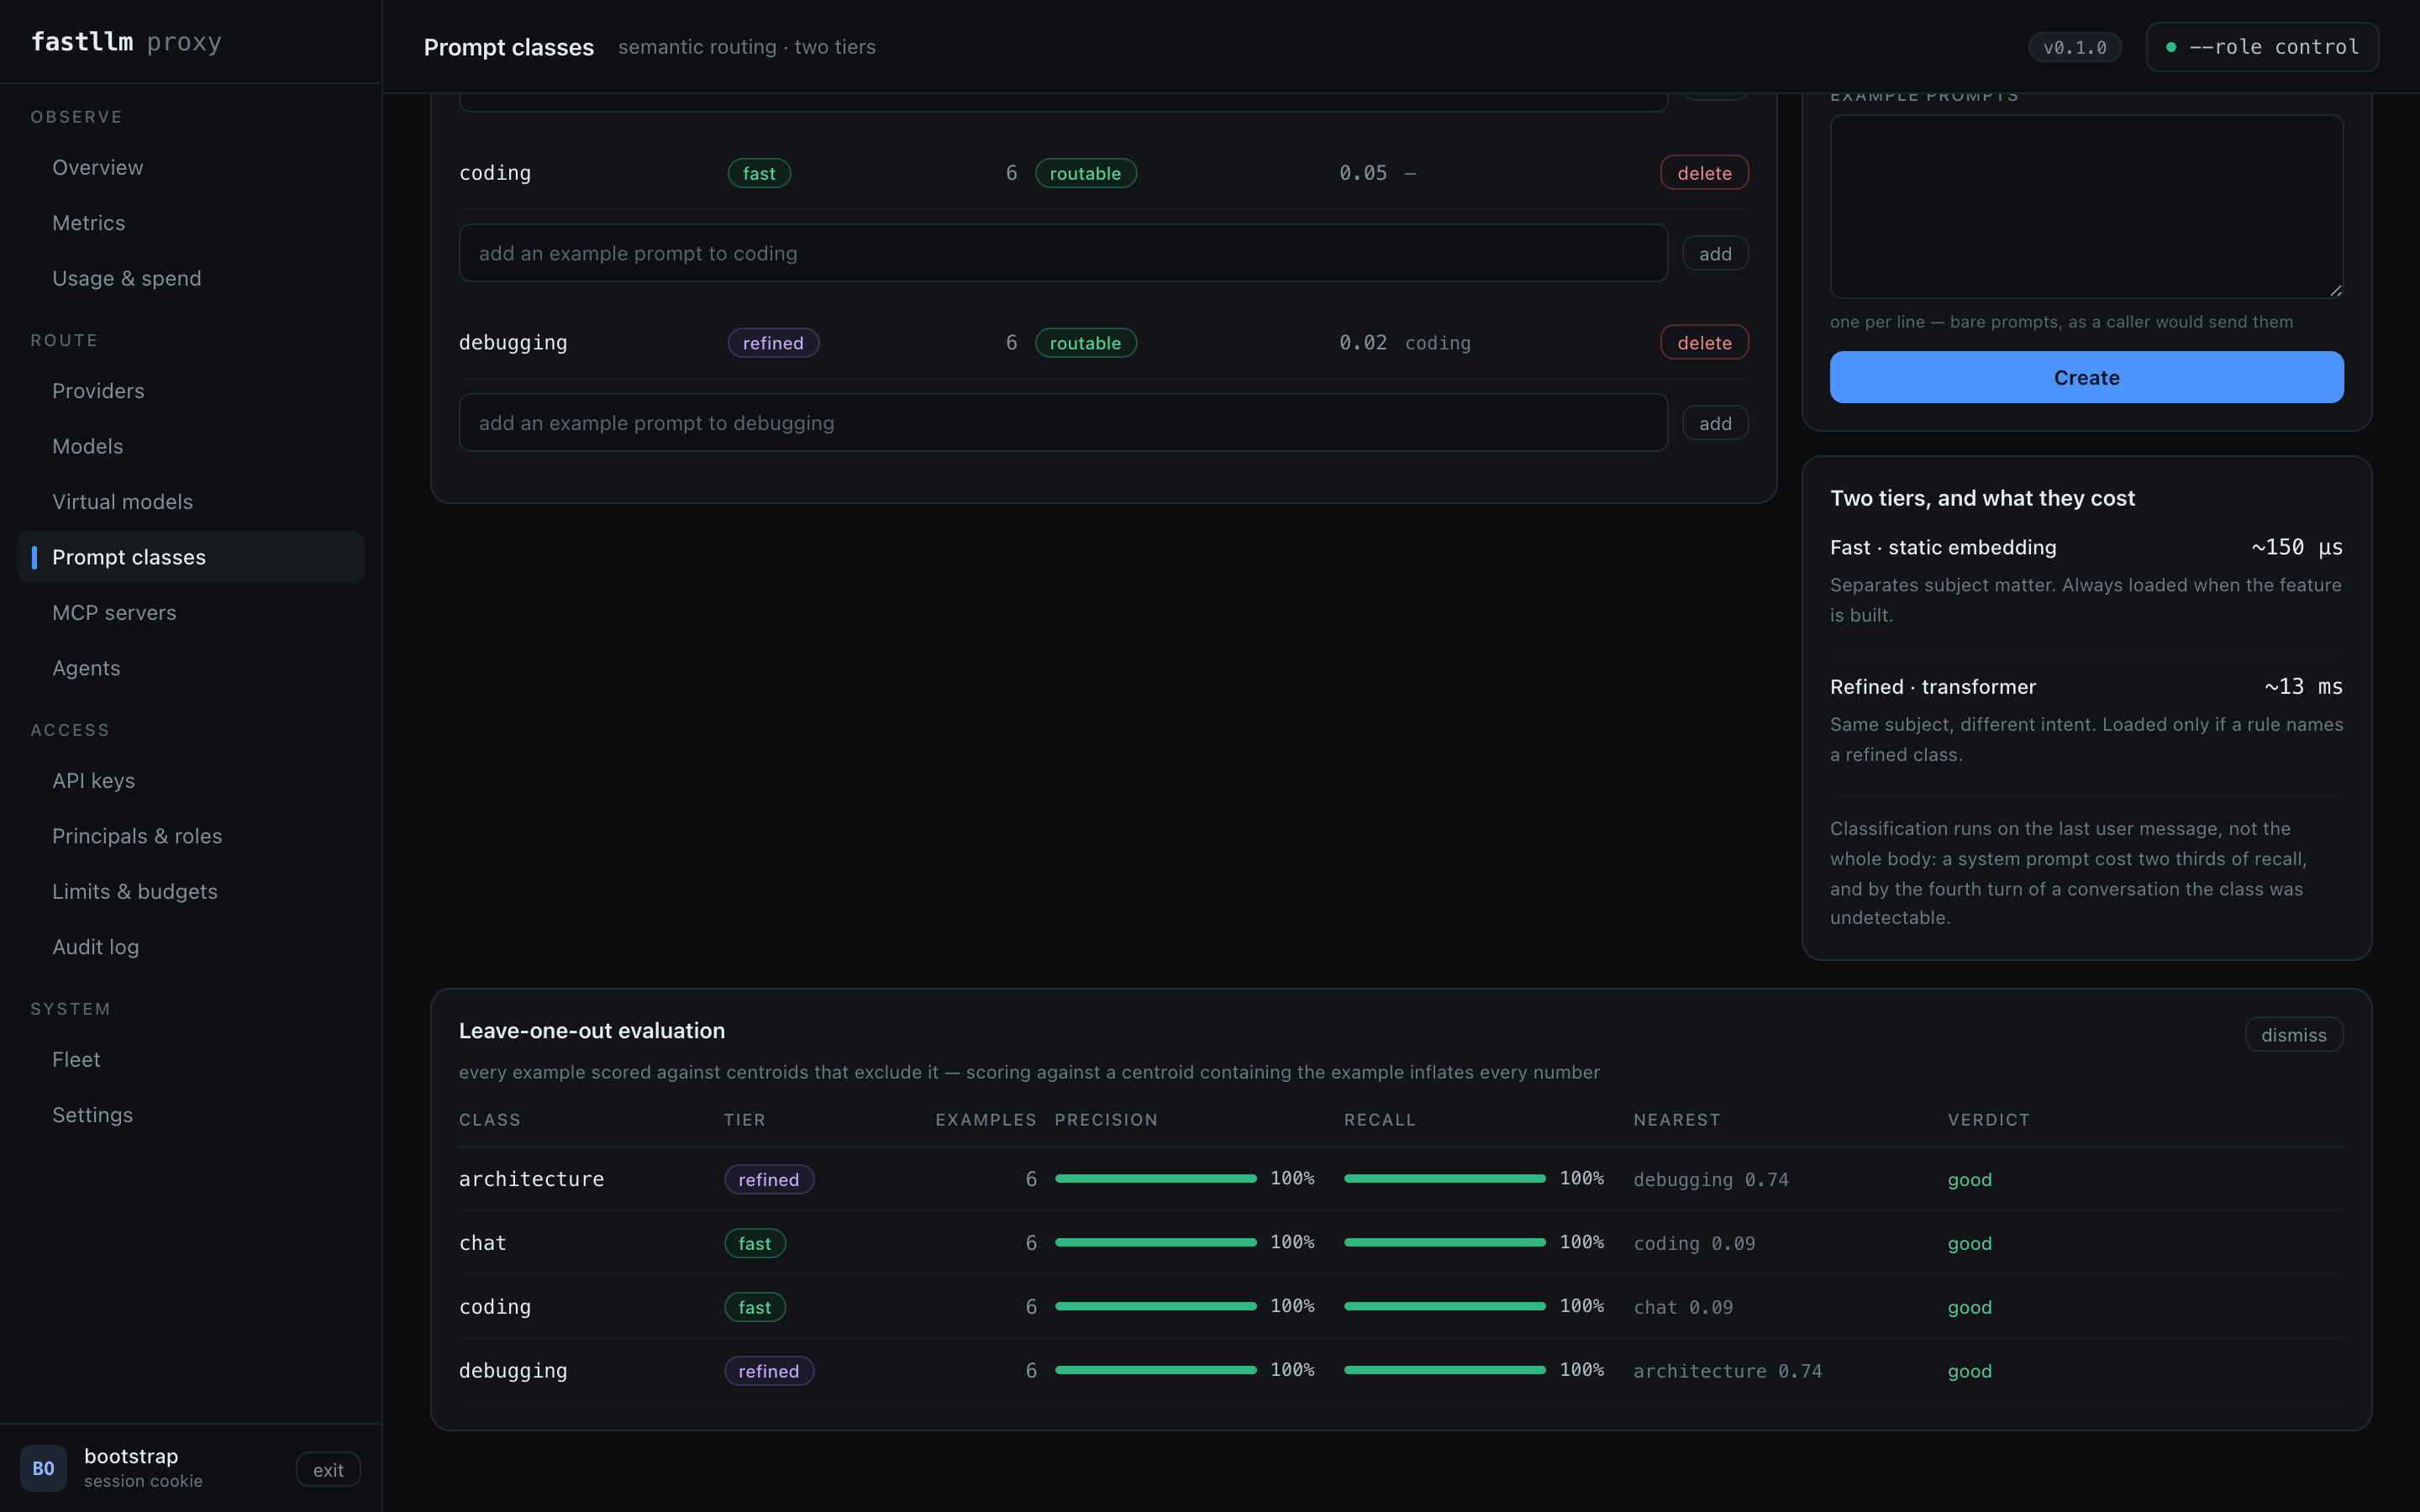
Per class: precision, recall, the nearest other class with its similarity, and
a verdict. Read the nearest column first. Two classes sitting above ~0.8
are one region with two names, and no threshold you pick will separate them —
the fix is different examples, not a different margin. Above, architecture
and debugging sit at 0.74 and still separate cleanly, because both are
refined classes doing exactly the job the refined tier exists for.
Overall accuracy is deliberately not the headline. A class that is a small share of your traffic can fail completely while accuracy barely moves — the base-rate trap that once hid a total classifier failure in this codebase.
Then name the class in a rule

On Frontend models, a rule's condition can be a prompt class, and its targets are weighted and ordered. Dry-run answers which rule a given prompt would hit and what the chain resolves to, without dispatching anything — which is how you confirm the classifier and the rule agree before real traffic depends on it.
Where next
The measurements behind every choice above — which classes separate, what each tier costs in production, and what is deliberately not built — are in what the classifier actually costs.
What the classifier actually costs
The measurements behind the design, so the decisions have their evidence attached and nobody re-litigates them from intuition.
The instruments that produced most of these numbers were one-shot: they answered "which model, which classes, which token cap" once, and this page is the answer. They have been removed rather than left to rot — a benchmark nobody runs is a benchmark nobody notices has broken. What remains is the one question that recurs, "is this candidate model better than the incumbent":
python3 bench/fetch-prompts.py                    # labelled prompts, cached to bench/data/
cargo run -p bench --release --bin minilm <dir>   # a candidate tier-2 model, same data
Datasets: HuggingFaceH4/no_robots (9,499 human-written, human-categorised
prompts), openai/gsm8k (1,000 maths word problems), and eleven StackExchange
communities (1,200 each) whose boundaries were drawn by the people asking
rather than by us.
Why two tiers
| model | p50 per prompt | separates |
|---|---|---|
| potion-base-2M | 8.4 µs | weakest of the static set |
| potion-base-8M | 103 µs | general subject matter |
| potion-code-16M | 115 µs | best on coding (98.7%) |
| potion-retrieval-32M | 137 µs | best all-round on synthetic data |
| all-MiniLM-L6-v2 | 1.66 ms | modest gain over the static tier |
| bge-small-en-v1.5 | 3.27 ms | same-subject / different-intent |
Those are laptop numbers — a 10-core arm64 macOS host, the conditions stated at
the top of performance.md. In the deployed container the
refined tier measures 50-100 ms, not 3.27 ms, taken from
fastllm_classify_duration_seconds on the dev cluster over escalated requests.
See "What escalation actually costs in production" below; the fast tier's ~115 µs
holds, since it is a memory lookup rather than a matmul.
Tier 1 is a token-vector lookup and a mean — no transformer, no matmul. Cost also plateaus rather than growing with the prompt, because the encoder stops at its token cap: a 64 KB paste costs what a 4 KB one does.
Measured token-cap sweep, potion-code-16M:
| max_length | p50 | accuracy |
|---|---|---|
| 32 | 32 µs | 76.7% |
| 128 | 115 µs | 80.0% |
| 512 | 460 µs | 80.0% |
128 is the chosen default: on real prompts it beat 32 for coding (98.7% vs 98.2%), because a coding question's giveaway is often the pasted code below the first line rather than the first line itself.
What tier 1 classifies well
Held out over real labelled prompts at a 0.05 margin floor:
| class | precision | recall |
|---|---|---|
| coding | 97.6% | 92.6% |
| chat | 95.8% | 98.0% |
| generation (creative, long-form) | 96.8% | 69.6% |
| math | 88.0% | 97.6% |
| devops | 86.8% | 90.5% |
| finance | 86.2% | 91.6% |
| legal | 85.9% | 75.0% |
| security | 84.8% | 82.3% |
| factual-qa | 83.7% | 50.4% |
| databases | 82.3% | 91.1% |
| ux-design | 75.6% | 79.8% |
| statistics | 74.0% | 66.5% |
Twelve viable classes on the 115 µs tier. Escalated to tier 2, writing-craft goes 78.8% → 93.5%, statistics 74.0% → 85.3%, legal 85.9% → 93.2% — tier 2 upgrades good to excellent, but rarely changes whether a class is usable.
What the request path classifies
The last user message, on its own — not the system prompt, not the earlier turns, and not the JSON around them.
That sounds obvious and was not what the code did. The classifier was handed the raw request body and read the first 128 tokens of it, while the centroids it compares against are built from bare example prompts an operator typed. Two different text distributions, and nearest-centroid classification cannot notice. Measured over 4,750 held-out prompts:
| query shape | accuracy | coding precision | coding recall | mean margin |
|---|---|---|---|---|
| bare prompt | 98.6% | 71.7% | 91.3% | 0.198 |
| minimal JSON body | 98.6% | 72.3% | 92.0% | 0.173 |
| body with a system prompt | 97.8% | 97.8% | 30.0% | 0.220 |
| turn 4 of a conversation | 96.8% | 0.0% | 0.0% | 0.225 |
| any of the above, after the fix | 98.6% | 71.7% | 91.3% | 0.198 |
Three things in that table are worth sitting with:
- The JSON wrapping was harmless. A minimal body scores the same as bare text. The damage comes from what fills the window before the user's words.
- A system prompt cost two thirds of recall, and by the fourth turn the class was undetectable — the question being asked sits at the end of the body, where a 128-token window never reaches.
- Accuracy never moved below 96.8%, because coding is a small share of
traffic. That is exactly the base-rate trap described further down this page,
hiding a total failure. And the mean margin rose as accuracy collapsed, so
a
min_marginfloor is no defence: the classifier was confidently wrong, and no threshold an operator could set would have filtered it.
Extracting the turn costs 208 ns on a single-turn request and 7.6 µs on a
40-turn one (bench/micro), against the ~150 µs the fast tier costs after it,
and it is only paid when prompt classes are configured.
Three findings that shaped the design
Classify by subject, not by verb. Subject-matter classes work. Task-shaped classes — summarise, rewrite, extract, classify — fail on both tiers. Under bge-small, Summarize scores 46.6% precision and Extract 35.6%, worse than the static model's 63.6% and 58.2%. Telling "summarise this" from "extract the dates from this" needs instruction understanding, not better sentence embedding, so no embedding tier fixes it. The same shape explains architecture versus coding: isolated it scores 75.3% (tier 1) and 93.3% (tier 2), but among eleven domains it collapses to 48.7% and 65.9%, because devops, databases and data-science compete for the same region.
Class count is not the problem; class definition is. In a ten-way run, Coding scores 83% precision and Chat 90% while Closed QA scores 20% and Extract 34%. Those three describe overlapping ideas. The design therefore does not cap the number of classes — it makes per-class quality measurable and lets the confidence floor be per class, since a class at 98% precision and one at 20% cannot share a threshold.
Margins are not comparable across models. bge-small reports an architecture/code-review centroid similarity of 0.943 against the static model's 0.621, while classifying the same data considerably better — its embedding space is anisotropic, packing everything into a narrow cone. A floor tuned on one tier is meaningless on the other. Floors are per class and per tier.
The confidence floor is structural
Coding is 3.5% of real traffic, so a classifier at 99% recall can sit at 20%
precision — it over-predicts the rare class, and accuracy hides it completely.
Measured coverage against accuracy, potion-code-16M, coding vs everything
else:
| floor | traffic classified | accuracy on it |
|---|---|---|
| 0.00 | 100% | 98.7% |
| 0.05 | 96% | 99.4% |
| 0.10 | 88% | 99.9% |
Below the floor a rule simply does not match and the next rule catches it — first-match-wins semantics, not a special case, not an error.
How the tiers are gated
Classifier::escalate_from is the set of tier-1 class names that some
active tier-2 class refines, computed at snapshot build. If no routing rule
references a tier-2 class the set is empty, the transformer is never loaded,
and no request can pay for it. A deployment using only tier-1 classes is
indistinguishable at runtime from one built before tier 2 existed.
When a request does escalate, tier 2 decides only between the classes that named that tier-1 class — a narrower question than the full taxonomy, and measurably an easier one.
On realistic traffic mixes escalation touches well under a tenth of requests. On the laptop figure that puts the average added cost near 0.2 ms; on the measured container figure it is nearer 2-3 ms, which is still modest against a 165 ms time to first token — but a request that does escalate pays the full 21-29 ms, and that is the number to weigh when a rule sends real traffic through tier 2.
What escalation actually costs in production
fastllm_classify_duration_seconds exists because the numbers above were taken
on a laptop against a fixed corpus, and nothing had measured them in the
container. fastllm-proxy classify-bench ships inside the image so the answer
comes from the pod's real CPU quota; reproduce with:
kubectl -n fastllm run classbench --image=<the deployed image> --restart=Never \
  --overrides='{"spec":{"containers":[{"name":"classbench","image":"<image>",
    "command":["/usr/local/bin/fastllm-proxy","classify-bench",
      "--classifier-tier2-model","/usr/local/share/fastllm/classifier-tier2"],
    "resources":{"limits":{"cpu":"2","memory":"2Gi"}}}]}}'
Measured, arm64 k3s node, per prompt:
| intra_threads | 2-core pod | 7-core pod |
|---|---|---|
| 1 | 49.9 ms | 49.6 ms |
| 2 | 28.9 ms | 32.1 ms |
| 4 | 28.7 ms | 21.3 ms |
| 8 | 53.2 ms | 31.2 ms |
Tier 1 measures 150-180 µs in the same pod, which matches its documented ~115 µs closely enough. The refined tier is 21-29 ms, not 3.3 ms.
Three things that ruled themselves out, each of which looked plausible first:
- Thread thrashing was the hypothesis, and it was wrong.
available_parallelism()reads/sys/fs/cgroup/cpu.maxcorrectly and returned 2 on a 2-core pod, so fastembed's default was never oversubscribed. The curve is still worth pinning — one thread is 1.7x worse than two, eight is 1.8x worse than four — soOptions::defaultnow setsclamp(2, 4)explicitly rather than deferring, which also protects a host where that call reads the node's cores instead. - CPU is not the lever. 3.5x the quota bought 1.35x the speed. This model does not scale with cores.
- The token window is not the lever either. 128 against 256 is within noise, because the window is a cap and these prompts are far shorter than either.
No configuration changes that, so the model did: the image now bakes the int8 build of bge-small rather than the fp32 one.
| fp32 | int8 | |
|---|---|---|
| per prompt, 2-core pod, 4 threads | 28.7 ms | 13.4-15.3 ms |
| model size | 133 MB | 34 MB |
| load | ~410 ms | ~265 ms |
| architecture precision @ 0.05 | 93.3% | 93.2% |
| code-review precision @ 0.05 | 91.0% | 90.8% |
| centroid similarity arch <-> code | 0.943 | 0.944 |
Roughly 2x, for a tenth of a point of precision. It was gated on the accuracy
rather than the latency because accuracy is the only reason this tier costs
anything: bench/minilm <dir> measures a candidate model against the same
StackExchange data as the incumbent, in one run, and that is the check to
repeat before ever swapping these weights again.
The centroid similarity barely moving matters as much as the precision: the
embedding geometry is unchanged, so a min_margin tuned against the fp32 model
stays valid and nobody has to re-tune a deployment to take this.
Worth noting what did not transfer: on an M-series laptop int8 measured no
faster than fp32 at all (3.63 ms against 3.58 ms). The win is specific to the
arm64 container this actually runs in, which is the argument for
classify-bench existing.
Concurrency buys nothing. At four concurrent callers, per-prompt latency is
unchanged from serial in every configuration above: Tier2 holds one ONNX
session behind a mutex because embed takes &mut self. Escalated throughput
therefore caps near 35/s per pod. A pool of sessions would lift that, but the
same table shows this model barely uses two cores, so extra sessions would
contend rather than scale — the ceiling is the model, not the mutex.
Classes compete globally
Every class in the snapshot is scored on every classified request. Two classes
seeded with neighbouring prompts produce neighbouring centroids, and the margin
between them collapses below any floor — so both stop matching and requests fall
through. POST /admin/prompt-classes/evaluate reports exactly this as a
collision, and it is the first thing to check when a class that looks correct
stops firing.
Per-request classification is logged at debug with the class, the margin and which tier decided, so drift is visible before somebody complains about answers.
The refined tier is loaded before it is needed
The transformer is loaded lazily, on the first prompt that escalates — and the load is not small. Measured on the dev cluster at ~570 ms, which was charged in full to whichever user's request happened to be first. The classify-duration histogram is what made it visible: two fast classifications at 115-500 µs and one at 570 ms in the same three requests.
A cliff that lands on one arbitrary request is worse than a slower start,
because it looks like an outage to exactly one caller and to nobody else. So
AppState::warm_refined_tier loads it on a background spawn_blocking task as
soon as a snapshot makes escalation reachable — at startup, or on the rebuild
that first adds a refined class.
The gate is unchanged: a deployment with no active refined class still never loads it, so tier-1-only remains indistinguishable at runtime from a build before tier 2 existed.
Memory
Both models ship in the image. Loaded, they cost real memory in whichever process uses them — measured on the dev cluster at 272-275 Mi for a control plane with both tiers, 268 Mi for a proxy that has lazily loaded the refined tier, against 85 Mi for a proxy doing no classification. Size limits accordingly; deploy/README.md has the table.
Not GPU work
Tier 1 is a memory lookup, not a matmul: 94,450 prompts/s on a single core, measured. PCIe transfer alone would exceed the whole compute budget. Tier 2 is a real transformer and would batch well on a GPU, but this workload is single-request and latency-critical — there is nothing to batch — and the GPUs in this deployment are busy serving the model. Both tiers stay on CPU.
Refined classes come in pairs
A refined class only takes effect when at least two of them refine the same fast-tier class. That is not a limitation, it is the shape of the question: the measurement behind this feature is binary — architecture against coding, at 93.3% — and a lone refined class has nothing to be compared against.
With one contender there is no runner-up, so the margin degenerates to a raw similarity score, and a margin-shaped floor like 0.10 is met by almost any prompt's similarity to almost any centroid. That one class would then capture every request the fast tier assigned to the class it refines. Escalation with fewer than two contenders is therefore skipped and the fast tier's answer stands.
So to split coding into architecture and debugging, define both as refined
classes, both refining coding.
A refined answer still satisfies a rule naming the class it refines. debugging
is a kind of coding, so an existing {"class": "coding"} rule keeps matching
after you add the refinement — put the more specific rule earlier in the chain
to separate them. Without that, defining a refined class would silently stop
every rule on its parent from firing, which is a change nobody asked for and
nobody would see.
What is not built
One thing deliberately out of scope: routing on difficulty. GSM8K separates from factual lookup at 96%, but GSM8K has a very distinctive narrative-maths genre, so that number most likely measures genre rather than difficulty. It would need an experiment against hard prompts that read like easy ones before it became a feature.
FastLLM Proxy — Brand & UI Guide
This document defines the visual identity for FastLLM Proxy and should be treated as the source of truth when implementing the website, documentation, dashboard, GitHub assets, and other product interfaces.
The visual language should communicate:
Speed · Intelligence · Routing · Efficiency · Infrastructure
The brand should feel like a modern developer/infrastructure product, not a generic AI application.
⸻
- Brand Identity
Product name
FastLLM Proxy
Preferred presentation:
FastLLM PROXY
Do not rename the product to:
- Fast LLM
- FastLLMProxy
- Fast LLM Proxy
- FLLM
In normal written copy, use FastLLM Proxy.
⸻
- Core Brand Concept
The logo combines three concepts:
Data flow
The horizontal lines represent requests/tokens flowing through the proxy.
Intelligent routing
The central arrow represents requests being routed toward the optimal destination/provider.
Speed
The trailing lines and neon glow create a sense of acceleration.
The hexagonal enclosure represents infrastructure, APIs, networking, and a controlled routing layer.
The UI should reinforce these concepts with subtle:
- data-flow lines
- routing paths
- gradients
- nodes
- network patterns
- hexagonal geometry
- restrained glow effects
Do not turn the entire interface into a cyberpunk dashboard. The branding can be visually energetic while the application UI remains clean and highly usable.
⸻
- Logo Assets
There are three primary logo variants.
A. Primary Logo
The full horizontal logo containing:
Icon + FastLLM + PROXY + tagline
Use for:
- website navigation/hero areas
- About page
- documentation landing pages
- login screen
- marketing pages
- presentations
- social previews
Do not use the full logo when available space makes the tagline difficult to read.
⸻
B. Icon / Favicon
The standalone hexagonal routing icon.
Use for:
- favicon
- browser tab
- app icon
- PWA icon
- GitHub organization/avatar
- compact sidebar
- loading screen
- mobile navigation
- social avatar
When displayed at small sizes, prefer the icon without surrounding text.
Recommended favicon sizes:
16×16 32×32 48×48 180×180 Apple Touch 192×192 PWA 512×512 PWA / high resolution
For very small sizes, preserve the overall hexagon/arrow silhouette rather than tiny details.
⸻
C. GitHub / README Banner
The wide banner is specifically intended for:
- GitHub README
- repository landing page
- documentation hero
- project announcements
- social sharing
Place it near the beginning of the README.
Avoid putting additional headings or text over the image.
⸻
- Primary Color Palette
The FastLLM identity is based around a transition from violet → electric blue → cyan.
Fast Violet
--fast-violet: #8B20FF;
Use for:
- intelligent-routing accents
- active indicators
- gradient origins
- selected states
- decorative glow
⸻
Electric Purple
--electric-purple: #6726FF;
Use as a transition between violet and blue.
⸻
Fast Blue
--fast-blue: #1769FF;
This is the main functional brand color.
Use for:
- primary actions
- links
- charts
- routing indicators
- focus states
- active navigation
⸻
Electric Cyan
--fast-cyan: #00D9F5;
Use for:
- successful routing
- optimized states
- highlights
- performance indicators
- gradient endpoints
Cyan should normally be an accent, not the dominant page color.
⸻
- Brand Gradient
The signature FastLLM gradient is:
background: linear-gradient( 90deg, #8B20FF 0%, #6726FF 25%, #1769FF 60%, #00D9F5 100% );
Create a reusable design token:
--gradient-fastllm: linear-gradient( 90deg, #8B20FF 0%, #6726FF 25%, #1769FF 60%, #00D9F5 100% );
Use this gradient for:
- FastLLM wordmark accents
- primary hero elements
- important CTA borders
- active routing visualization
- loading indicators
- selected metric highlights
- occasional headline text
Do not apply the gradient to large amounts of body text.
⸻
- Dark UI Palette
FastLLM should be dark-first.
The primary application background should not be pure black.
Background
--bg-primary: #030817;
Elevated Background
--bg-secondary: #071126;
Cards
--bg-card: #0A1530;
Elevated Cards
--bg-elevated: #0D1B38;
Borders
--border-subtle: #17254A;
Strong Borders
--border-strong: #253A6B;
These blue-black tones keep the interface visually connected to the logo.
⸻
- Text Colors
Primary
--text-primary: #F8FAFF;
Use for:
- headings
- important values
- primary content
Secondary
--text-secondary: #AAB7D1;
Use for:
- descriptions
- labels
- secondary content
Muted
--text-muted: #687897;
Use for:
- timestamps
- hints
- inactive elements
- secondary metadata
Avoid pure gray wherever possible. FastLLM neutrals should contain a subtle blue tint.
⸻
- Semantic Colors
Do not use the brand gradient for every application state.
Maintain clear semantic colors.
--success: #20D997; --warning: #F5B942; --danger: #FF5570; --info: #23B7F5;
Examples:
Provider online
● Online
Use success green.
Provider latency warning
Use warning amber.
Provider failure
Use danger red.
Optimized / cached
Cyan can be used because optimization is part of the FastLLM brand vocabulary.
⸻
- Recommended Complete Token Set
The AI coder should create centralized tokens rather than hard-coding colors throughout components.
:root { /* Brand / --fast-violet: #8B20FF; --electric-purple: #6726FF; --fast-blue: #1769FF; --fast-cyan: #00D9F5; / Background / --bg-primary: #030817; --bg-secondary: #071126; --bg-card: #0A1530; --bg-elevated: #0D1B38; / Borders / --border-subtle: #17254A; --border-strong: #253A6B; / Text / --text-primary: #F8FAFF; --text-secondary: #AAB7D1; --text-muted: #687897; / Semantic / --success: #20D997; --warning: #F5B942; --danger: #FF5570; --info: #23B7F5; / Brand gradient */ --gradient-fastllm: linear-gradient( 90deg, #8B20FF 0%, #6726FF 25%, #1769FF 60%, #00D9F5 100% ); }
All application components should consume the design system rather than introducing arbitrary colors.
⸻
- Typography
FastLLM should use modern geometric sans-serif typography.
Preferred:
Inter
Alternative:
Geist
Both work extremely well for developer tooling and dashboards.
Recommended stack:
font-family: Inter, Geist, -apple-system, BlinkMacSystemFont, "Segoe UI", sans-serif;
For technical data use:
JetBrains Mono
or
Geist Mono
Use monospace for:
- API keys
- model names
- request IDs
- endpoints
- tokens
- latency
- logs
- JSON
- code
Example:
openai/gpt-5 anthropic/claude-sonnet 34 ms 12,482 tokens $0.0142
⸻
- Typography Hierarchy
Hero
48–72px 700–800 weight
H1
36–48px 700
H2
28–32px 600–700
H3
20–24px 600
Body
14–16px 400
Labels
12–14px 500–600
Dashboard typography should remain compact and information-dense.
⸻
- UI Design Philosophy
The dashboard should feel like a combination of:
developer infrastructure + observability + AI routing
It should NOT resemble:
- a crypto application
- a gaming UI
- a generic ChatGPT clone
- an overly glowing cyberpunk interface
Think:
clean infrastructure UI with restrained futuristic accents.
Approximately:
90% clean interface
10% neon branding
⸻
- Cards
Cards should use dark navy surfaces.
Example:
.fast-card { background: #0A1530; border: 1px solid #17254A; border-radius: 12px; }
On hover:
.fast-card:hover { border-color: #253A6B; }
Important cards may receive a subtle blue glow:
box-shadow: 0 0 24px rgba(23, 105, 255, 0.08);
Keep glow subtle.
⸻
- Buttons
Primary
Use blue or the FastLLM gradient.
background: var(--gradient-fastllm); color: white;
Typical actions:
- Add Provider
- Create Route
- Save Configuration
- Create API Key
Secondary
background: #0D1B38; border: 1px solid #253A6B; color: #F8FAFF;
Destructive
Always use the danger color rather than purple.
⸻
- Border Radius
Use moderately rounded geometry.
Buttons: 8px Inputs: 8px Cards: 12px Dialogs: 16px Large panels: 16px
Avoid excessive pill-shaped UI.
Pills are appropriate for:
- status
- model labels
- provider labels
- tags
⸻
- Glow Effects
Glow is part of the brand but should be controlled.
Recommended:
box-shadow: 0 0 20px rgba(0, 217, 245, 0.12);
or
box-shadow: 0 0 24px rgba(139, 32, 255, 0.12);
Strong neon glow should mainly appear in:
- marketing pages
- hero areas
- loading screens
- routing visualizations
Do not surround every dashboard component with neon.
⸻
- Dashboard Visual Language
The dashboard should visually communicate requests flowing:
Application ↓ FastLLM ↓ Routing ↙ ↓ ↘ OpenAI Anthropic Local
Routing visualizations can use the brand gradient.
For example:
incoming request
Purple
↓
FastLLM processing
Blue
↓
optimized/routed request
Cyan
This creates a visual meaning for the brand gradient rather than using it decoratively.
⸻
- Metrics
Important metrics should be immediately readable.
Examples:
Requests 1.24M Cache Hit Rate 67.4% Tokens Saved 42.8M Average Latency 38 ms Cost Saved $1,284
Values should be visually dominant.
Labels should use secondary text.
Use cyan or blue sparingly to emphasize positive optimization metrics.
⸻
- Charts
Charts should use the brand palette.
Recommended series order:
#1769FF #00D9F5 #8B20FF #6726FF
Semantic events should override brand colors.
Errors:
#FF5570
Warnings:
#F5B942
Success:
#20D997
Chart backgrounds should remain transparent or match card surfaces.
Grid lines should use:
#17254A
⸻
- Provider Identity
Provider logos should retain their official branding.
Examples could include providers such as:
OpenAI Anthropic Google Mistral Groq OpenRouter Azure AWS Local / vLLM
Do not recolor provider logos into the FastLLM gradient.
FastLLM branding should surround provider identity rather than replace it.
⸻
- Icons
Use one consistent icon library.
Preferred:
Lucide
Use line icons with approximately:
1.5–2px stroke
Typical mappings:
Routing → Route Providers → Network Caching → Database Performance → Gauge Cost → CircleDollarSign Requests → Activity Models → Brain API Keys → Key Logs → ScrollText Settings → Settings
Do not mix multiple unrelated icon styles.
⸻
- Navigation
Recommended sidebar:
[ FastLLM icon ] Overview Routing Providers Models Requests Cache Analytics API Keys Settings
The selected item can use:
background: rgba(23,105,255,0.12); color: #F8FAFF;
with a blue/cyan indicator.
⸻
- Inputs
Inputs should be understated.
background: #071126; border: 1px solid #17254A; color: #F8FAFF;
Focused:
border-color: #1769FF; box-shadow: 0 0 0 3px rgba(23,105,255,0.15);
Never use large neon glows around form fields.
⸻
- Tables
FastLLM will likely contain significant operational data, so tables should prioritize readability.
Use:
dark background subtle row separators compact spacing monospace technical values clear status indicators
Example:
Provider Model Latency Tokens Cost Status OpenAI gpt-* 38ms 1,842 $0.014 ● Anthropic claude-* 44ms 1,731 $0.012 ● Local qwen-* 21ms 2,103 $0.003 ●
Avoid heavy borders around every cell.
⸻
- Background Decoration
Marketing pages may use:
- subtle hexagonal grids
- flowing data lines
- blurred gradient orbs
- network nodes
- light trails
Example background glow:
background: radial-gradient( circle at 20% 20%, rgba(103,38,255,.12), transparent 35% ), radial-gradient( circle at 80% 30%, rgba(0,217,245,.08), transparent 35% ), #030817;
Dashboard pages should use significantly less decoration.
⸻
- Motion
Animations should reinforce speed and routing.
Good:
- data moving along paths
- subtle gradient movement
- request pulses
- routing-node activation
- fast card transitions
- number/count animations
- subtle loading streaks
Avoid:
- bouncing UI
- excessive floating elements
- long transitions
- large parallax effects
Recommended UI transition:
transition: 150ms ease;
The product is called FastLLM. The UI should therefore feel immediate.
⸻
- Loading State
Avoid generic spinning loaders when possible.
A branded loader can animate:
────●────→
or animate the three input lines of the FastLLM icon toward the arrow.
The animation should suggest:
request → processing → routing
⸻
- Light Mode
Dark mode is the canonical FastLLM identity.
If light mode is implemented, preserve:
- blue
- violet
- cyan
- dark navy typography
Do not redesign the brand around pastel colors.
Suggested light background:
#F6F8FC
Cards:
#FFFFFF
Text:
#071126
Borders:
#DCE4F2
The dark theme should remain the default visual reference.
⸻
- Logo Rules
Always:
- preserve aspect ratio
- maintain clear space around the logo
- use supplied logo files
- keep the gradient intact
- use the icon when space is constrained
Never:
- stretch the logo
- rotate it
- recolor it randomly
- add another gradient
- add drop shadows unrelated to the original design
- place it over visually noisy content
- separate parts of the icon
- recreate the logo using an icon library
⸻
- Clear Space
Maintain approximately 20% of the logo height as minimum clear space around the logo.
For the standalone icon, use approximately:
10–15% internal padding
when used as an application icon.
⸻
- README Usage
Recommended README structure:
[BANNER] FastLLM Proxy Short product description Badges Why FastLLM? Features Architecture Quick Start Configuration Providers Routing Caching / Optimization Observability Benchmarks Documentation Contributing License
Because the banner already contains the logo and product identity, avoid immediately repeating another giant logo underneath it.
⸻
- Marketing Tone
The visual should be concise and technical.
Preferred messaging:
Faster. Smarter. Cheaper.
Supporting themes:
Route intelligently. Choose the right model/provider for each request.
Reduce latency. Cache and optimize wherever possible.
Reduce cost. Avoid spending tokens and compute unnecessarily.
Stay provider-independent. Applications integrate with FastLLM rather than individual LLM providers.
Avoid vague AI marketing language such as:
- revolutionary AI
- unlock the power of AI
- next-generation intelligence
- transform your AI journey
FastLLM should sound like serious infrastructure software.
⸻
- Overall Visual Reference
When creating a new FastLLM page or component, ask:
Does this look like a high-performance piece of infrastructure that happens to route AI workloads?
The answer should be yes.
The visual hierarchy should generally be:
Dark Navy Foundation ↓ Clean Functional UI ↓ Electric Blue Interaction ↓ Violet → Blue → Cyan Brand Accents ↓ Subtle Glow / Data-flow Effects
Not:
Neon everywhere
- gradients everywhere
- glowing borders everywhere
The logo is intentionally expressive. The application surrounding it should give it room to stand out.
⸻
- AI Coder Implementation Rules
When implementing or modifying FastLLM Proxy, follow these rules:
- Use this brand guide as the design-system source of truth.
- Use the supplied logo assets. Never recreate the logo.
- Default to the dark FastLLM theme.
- Store colors as centralized design tokens/theme variables.
- Never introduce arbitrary purple, blue, cyan, gray, or background colors when an existing token is appropriate.
- Use the violet → blue → cyan gradient only for high-value brand elements.
- Use Fast Blue #1769FF as the primary functional interaction color.
- Use semantic green, amber, and red for success/warning/error states rather than forcing brand colors.
- Keep dashboard surfaces clean and restrained.
- Reserve strong neon effects for marketing areas, routing visualizations, and branded loading states.
- Use Inter/Geist for UI typography and JetBrains Mono/Geist Mono for technical values.
- Prefer Lucide for UI icons.
- Maintain WCAG-readable contrast for all functional text.
- All components must look coherent in the overall FastLLM design system.
- Before adding a new visual treatment, determine whether an existing token/component already solves the requirement.
- Reuse shared components for buttons, cards, inputs, badges, dialogs, tables, tooltips, and navigation.
- Avoid inline styling and duplicated color definitions.
- Keep animations short and purposeful.
- Make responsive behavior part of the component implementation rather than an afterthought.
- Functionality and readability always take precedence over decorative branding.
Core design instruction
Build FastLLM Proxy as a clean, premium developer-infrastructure product using a dark navy foundation and restrained violet → electric blue → cyan accents derived directly from the FastLLM logo. The logo is visually expressive; the application UI should be cleaner and quieter. Use neon/glow primarily to communicate routing, activity, optimization, and speed—not as decoration.
This rule should guide any UI decision not explicitly covered elsewhere in this document.
The quality gate
The repository is governed by procoder, a formatting-and-hygiene gate that
runs on every write and on every commit. Its policy files live under
.procoder/ in the repository root; edit those to change what the gate
enforces. This page is the command roster, so a contributor can discover
what the tooling offers without leaving the docs.
Everyday commands
procoder doctor— which formatters this repository needs, which are installed, and how to install the rest.procoder init— install the missing formatters, every command visible before it runs.procoder check— the commit gate over your changed files; unchecked counts as failing.procoder format— print a file's formatted result so you can review it before writing it.procoder audit— every domain's checks over the whole tree; how this repository was first brought in line.
Per-domain reports
procoder lint— the canonical linter per ecosystem over your changes.procoder security— secrets over the changed files (blocking);--deepadds SAST and dependency vulnerabilities over the whole repository.procoder ci— workflow hygiene: pinned actions, job timeouts, concurrency cancellation.procoder infra— Dockerfiles, Terraform, Kubernetes manifests, Helm charts, where those files exist.procoder docs— broken references, diagram drift, required docs, README structure;--externaladds link checking.procoder git— the pre-finish status: branch, hygiene, message checks, templates.procoder maintain— dead-code candidates, complexity, function length; judgment calls, never blocking.
The index and the ledger
procoder index— the code index built from ctags and SCIP: find, search, refs, outline, impact.procoder debt— harvestdebt:markers into a ledger; a marker with no revisit trigger is flagged as rot.
Workflow commands
procoder spec— the gap-closing interview that produces a complete specification.procoder plan— turn an approved spec into an implementation plan.procoder todo— the quality-gated task list; a task only closes when the controller agrees it is done.
Plumbing
procoder agents— keep per-host agent rule files in sync withAGENTS.md.procoder templates— print the default.procoder/policy files.procoder principles— the engineering principles text the gate is built around.procoder lessons— lessons recorded from past sessions.procoder scrub— scrub transcripts before sharing them.procoder hook— the write-hook entry point the harness calls; not for humans.procoder version— which version answered.
Changelog
Notable changes, newest first. Format follows Keep a Changelog.
Commit bodies carry the reasoning and the measurements and remain the better source for why anything is the way it is; this file is the summary.
0.3.3 — 2026-10-05
Changed
- Every provider is named
<cluster>-<node>-<model>-<port>. Services advertised throughfastllm.io/advertisewere named<cluster>-<port>because the agent knew neither their node nor their model, so two engines on one port in one cluster collided and the second fell back to a bare address. The agent now takes the node from the pods a Service selects and the model from the first id/v1/modelsanswers with, folds each part to lowercase[a-z0-9.]and dashes, and leaves out a part it cannot know. Names travel on every heartbeat, so upgrading the agent renames existing providers in place; routing follows model names, not provider names.
Fixed
- A provider deleted mid-sweep no longer fails the whole sweep. The sweep read each provider's kind in a second query; one deleted in between (a lapsed lease, an operator's delete) found no row and aborted the sweep for every other provider. It is also why one control-plane test failed intermittently.
Security
fastllm.io/advertiseis honoured only forhttp(s)URLs. urllib also opensfile://paths, so anyone able to annotate a Service could otherwise choose what the agent reads.
0.3.2 — 2026-10-05
Fixed
- A host that swapped models is re-learned, not stranded. When a Spark's engine went from qwen3.5-9b to the 35B on the same port, the sweep called it a mismatch and marked it degraded — and a degraded provider is one the sweep does not reconcile, so the registry kept routing qwen3.5-9b to an engine that no longer had it. The agent's heartbeat cleared the flag every thirty seconds, so the provider's models also flapped in and out of every snapshot. A dynamic provider's mismatch is now reported and resolved in the same pass; a static or cloud provider's still degrades and waits for a human.
- The node agent finds engines that name their port only in a health
probe, as the audio.cpp servers (nemotron ASR, Breeze TTS) on kw do: the
numeric port of an
httpGetreadiness, liveness or startup probe is read after--port. - Providers on one cluster get distinct names. Under
--kubernetesthe name adds the node or Service —kw-gx10-9c17-8000— so two engines on one port on different nodes no longer collide.
0.3.1 — 2026-10-05
Fixed
- The node agent keeps its leases on a cluster. Discovery probed every
candidate in turn — on kw about 330 LoadBalancer and host-network ports,
each allowed the full probe timeout — and lease renewal waited for it, so a
pass took over a quarter of an hour against a 90-second lease. It only
looked healthy because the Sparks' old host agents were renewing the same
endpoint. Candidates are now probed concurrently (
--probe-workers, 32; a pass on kw takes about 35 seconds), and leases are renewed every--intervalfrom the last discovery's result while discovery runs on its own clock (--discover-interval, 60s). agent/kubernetes.yamlstarts. It passed--kubernetesascommand, which replaces the image's entrypoint, so the container tried to execute the flag; it isargsnow. It also carried NovaNAS's node name and advertise address, and now carries kw's, with the image pinned to the release and held there by the release-consistency test.- The registering-hosts doc describes the steps that work: where the CA
comes from, how to mint the agent's key (a principal's
sk-key — the proxy token is refused), thenodesRBAC, and that the Sparks no longer run the systemd agent.
0.3.0 — 2026-10-05
Added
-
The node agent ships as an image, and speaks Kubernetes. The host agent — the thing that registers a machine's model endpoints with FastLLM and keeps the lease warm — is packaged as
ghcr.io/azrtydxb/fastllm-node-agent(arm64 + amd64, built by the release job), and under--kubernetesit discovers what to register from the API instead of probing ports: exposed Services (NodePort, LoadBalancer) and hostNetwork pods, each addressed by its own node's InternalIP and accepted only if it answers/v1/models.agent/kubernetes.yamlruns it against kw, where it registers the engines running on the gx10 nodes. The registering-hosts operations doc carries the deploy steps. -
Reasoning through
/v1/messages. A backend'sreasoning/reasoning_contentbecomesthinkingblocks, streamed asthinking_delta. Found running it against the live gateway: a reasoning model that spends itsmax_tokensthinking returnscontent: null, which came back as an empty message. -
An Anthropic Messages frontend (#30).
POST /v1/messageswith streaming SSE,tool_use/tool_result, images,stop_reasonandusage(cached tokens included);x-api-keyor bearer auth;POST /v1/messages/count_tokensas a local estimate;GET /v1/modelsin Anthropic's shape when the request carriesanthropic-version. Translated onto the ordinary request path, so routing, budgets, rate limits and RBAC apply unchanged. Thinking blocks are dropped, and an Anthropic backend behind it is translated twice rather than passed through. -
An id is a uuid, and no longer a count. All 17 tables that have an identity migrate from
BIGSERIALto UUID v4 (migration 0041), generated from the live foreign-key graph rather than hand-typed and tested by migrating a restored dump of the running cluster./admin/provider-models/6351used to say how many models a deployment had ever had and what the next one would be called; now that an id is the stable thing an operator and the API both hold on to, it should not also be a count.audit_eventsandusage_eventskeep a sequence id on purpose — theirs are cursors into an append-only log, and the audit listing pages withWHERE id < $1 ORDER BY id DESC, which means "newer than" only because the id is a sequence. -
Names are editable in the UI. Click one on Provider models or Frontend models. The hint differs between them on purpose: renaming a provider model is an internal relabel, while a frontend model's name is what clients ask for, so renaming it changes the deployment's public API — grants follow, callers do not.
-
Everything with a name can be renamed, and a rename no longer breaks links. Provider models, frontend models, MCP servers, A2A agents, principals and roles all take a
nameon their PATCH route; principals and roles gain one. Renaming used to be impossible on purpose — three separate things recorded a model's name and every one of them would have broken. Targets now resolve by id and fall back to the recorded name, so a rename is followed automatically while a deleted model still leaves a target naming what it wants (migration 0036's reason for existing);relink_targetsputs the id back when that model returns. Grants move in the same transaction as the rename, because amodel/<name>left behind revokes everyone holding it — which is what migration 0034 found by doing it. Usage history deliberately does not move: it records what a thing was called when the request was served. -
Providers have names chosen by whoever knows what they are. A cloud provider takes the vendor's name from the catalogue (
OpenRouter, notopenrouter.ai); a dynamic one is named by the agent registering it, sent on every heartbeat so changing--provider-namerenames it; a static one is named by whoever adds it and can be renamed in place on the Providers screen. Safe because routing resolves a target by its model's name — the rename is carried ontotarget_provider_nameso nothing is left naming a provider that no longer exists. -
The Providers screen shows what kind each provider is. A
static/cloud/dynamicbadge, which is the thing that decides whether anything may remove it. The two-letter tile that used to sit on each card is gone; it was the first two characters of a hostname, so every LAN provider showed19. -
An endpoint can be handed to the agent on its host, and taken back.
kindonPATCH /admin/providers/{id}. Registration never converts a static provider into one that can expire, which is right — an agent must not be able to take over an endpoint a human typed in — but it left no way to opt in either: putting an agent on a host whose endpoints were already configured by hand registered them and changed nothing. Leavingdynamicclears the lease and any degradation with it, since the sweep readslease_expires_atwhatever the kind and an expired one would report the provider unreachable for ever. -
The node agent can be told which CA to trust.
--ca-cert, and deliberately no--insecure: the bearer token it presents goes over that connection. Found by installing it on this project's own DGX Sparks, where the control plane's certificate comes from an internal CA and every registration failed onCERTIFICATE_VERIFY_FAILED.agent/fastllm-node-agent.serviceis the systemd unit those hosts now run. -
Fixed: a UI deploy was invisible to anyone already using it.
index.htmlwas servedno-cache— "revalidate before using me" — with noETagorLast-Modifiedto revalidate against, so browsers served the cached shell. That shell names content-hashed assets which are, correctly, cached for a year, so the old bundle kept loading and a hard reload was the only cure. The shell now carries the content hashrust_embedalready computed, and answersIf-None-Matchwith a 304 — which also delivers the transfer saving the old comment claimed but could not provide. -
Fixed: a response from an upstream that hangs up was thrown away.
Upstream::requestdrives the connection itself, and treated the connection finishing as "no response came" — but polling the connection is what reads the response, so one delivered on the way out was discarded and reported asupstream closed the connection before sending a response. Any upstream answeringConnection: closehit it, which is legal and happens under load. Found because a test stub did exactly that. -
A provider reports what its engine is doing. The sweep already dials each provider once a minute for its model list; on the same pass it reads
/metrics, which vLLM and SGLang both publish, and records requests running, requests queued and KV-cache utilisation (migration 0044). The Providers screen said "1 of 1 up" for an idle box and one with forty requests queued alike. A provider that publishes no metrics — every hosted one — leaves the columns NULL and the row is simply not drawn, because absent and zero are different things. -
kindsays where a provider's details came from, not where its host lives.cloudis preconfigured from the catalogue and needs only a credential;dynamiccomes from an agent;staticis one an operator typed in and filled out. A hand-typed address was being labelledcloudwhenever its hostname was public, which claimed a provenance it did not have. The edit form offers the protocol forstaticonly — the other two already know it. -
A provider can be edited, and is dialled before it is saved. Add, edit and remove on the Providers screen: name, address, protocol, kind, auth header and scheme, and the credential, all in one form opened by clicking the card. The endpoint is dialled before the row is written and nothing is stored unless it answers with its models — a rejected credential, an unreachable address and a path with no model list are all refused, the last because a 404 says the host is there and the path is not, which is overwhelmingly a mistyped address. The form shows the name, address, protocol and credential; the auth header, the scheme and the kind are how the credential is transmitted and which machinery maintains the row, neither of which is a question to put to whoever is adding a provider.
-
The catalogue covers every provider the docs name. It held fourteen of the eighty
docs/providers.mdlists — the ones somebody had typed an address for — which made the Add provider dropdown read as the list of what FastLLM supports rather than the list of what had been seeded (migration 0042, withtests/doc_claims.rsnow guarding the two together). Entries whose address is a fixed verified one carry it; the rest carry a<placeholder>the API refuses to store, which covers self-hosted engines and account-scoped endpoints. Five base URLs come fromgo-ai-sdkand thirteen from LiteLLM's ownopenai_compatible_endpoints, with the rest read off the vendor's documentation;notesrecords the source for each, so a moved endpoint has somewhere to go and check. The twenty-three placeholders that remain are the ones nobody but the operator can fill in: self-hosted engines and account-scoped endpoints. -
Both dropdowns can be filtered. The provider catalogue and the served-model list are eighty and four hundred entries respectively.
-
The model dropdown can be filtered. A provider can serve several hundred models — OpenRouter answers with upwards of four hundred — and scrolling to one whose name you already know is the slowest way to pick it. The count reads
12 of 431while a filter is on, and the chosen model stays in the list even when the filter would drop it, because a select whose value is not among its options renders blank and reads as "your choice was lost". -
Adding a model starts from the provider that serves it. An Add model dialog on the Provider models screen: pick a provider, and it reads that endpoint's
GET /v1/modelsand offers what it serves, filling the local name in from the one you choose. It replaces a form that asked for a name first and an address afterwards — an order that required knowing the upstream model's name from memory before anything had offered it, and left a model routing nowhere in between. The two writes are one intent: a failed attach removes the model created a moment earlier rather than leaving a name that routes nowhere and blocks the retry with a duplicate-name conflict. -
The catalogue says which credentials a vendor takes.
provider_catalogue.credential_kinds(migration 0040), returned byGET /admin/provider-catalogue. Only Vertex AI accepts anything but a static key, so the Add provider form asks that question only where there is an answer to give rather than putting a Google-shaped dropdown in front of someone adding Groq — and the UI reads that from the catalogue instead of naming a vendor in a component. -
Providers can be added, edited and credentialled from the UI.
POST /admin/providersandPATCH /admin/providers/{id}, and an Add provider form on the Providers screen with two ways in: a cloud vendor picked from the catalogue, which fills in its base URL and the header it wants its key in, or a typed address for anything else. Before this a provider could only appear as a side effect of attaching a backend, so the endpoint's credential had to be typed on a model form, and a provider with no models yet — the state you are in while deciding which of its models to serve — could not be expressed at all. Rotating a key is one write on the provider card. -
Attaching a model starts from its provider, and offers what that provider serves.
POST /admin/provider-models/{id}/backendstakes aprovider_id, and the Provider models screen browsesGET /v1/modelson the chosen provider so an upstream name is picked from what the endpoint actually answers with rather than typed from memory. Already-registered models are marked. Endpoint fields alongside aprovider_idare refused rather than ignored: the caller would otherwise believe they had set a credential there while the provider's is what gets sent. -
A provider is a record. It was a grouping the UI invented at render time, so nothing could register, count or refer to one, and the 80 providers in
docs/providers.mdhad nothing to attach to.providersnow owns the endpoint, the credential, the protocol and the auth scheme; a provider model belongs to exactly one provider andmodel_backendsis gone (migration 0029). Rotating a shared key is one write where it was one per model. -
Hosts that serve models can register themselves.
agent/fastllm-node-agent.pyregisters an address on a lease and heartbeats; the control plane callsGET /v1/modelsitself, so discovery and reachability are the same test and a model the proxies cannot dial is never registered. Every engine answers that one call, so there is no engine matrix and no container mode. Seedocs/operations/registering-hosts.md. -
Providers are probed for identity, not just liveness. One call per provider answers both "is it reachable" and "is it still serving what is registered against it". The second is the drift that motivated this: a host answering happily while serving a different model than the row claims, which a health check reports as healthy. A dynamic provider that stops answering degrades first and is deleted only after 30 minutes — longer than a model load, because suppressing routing is reversible and deletion is not.
-
Usage survives the model that served it.
usage_eventsrecords the model and provider name at ingest and the foreign key is nullable, so deleting a model no longer erases what it was billed for (migration 0031). The hourly rollup is keyed by name for the same reason — itsmodel_idwasNOT NULLand part of the primary key, so a deleted model would have failed the whole retention batch. -
Load balancing is per provider model, not per process.
--policywas a deployment-wide flag, which is the wrong shape the moment one control plane serves both kinds of pool — two identical local replicas sharing a prefix cache wantcache-affinity, three hosted providers of differing speed wantlowest-latency, and a flag can only be one of them. Each provider model may now carry its own (migration 0028,policyonPOST/PATCH /admin/provider-models, a control on the Provider models screen). Unset means the deployment default, so an existing database behaves exactly as it did. -
The price sync can replace a price that is already set. It never overwrote by design — a negotiated rate must not be replaced by a list price — but that left a model priced wrongly unreachable from the UI, including one sitting at
0, which reads as free. The preview now has a "replace prices that are already set" toggle, off by default, that re-previews as it changes.
Changed
-
Two words for two things: provider model and frontend model. A provider model is what a request is routed to — one name on one provider, since the same model on two hosts is two provider models. A frontend model is what a client asks for: rules and weights resolving to a chain of them, and the only name a client is meant to use. The schema, the API, the UI and the documentation all use those words now:
provider_modelsandfrontend_models,/admin/provider-modelsand/admin/frontend-models(migration 0033). The old routes are gone rather than aliased — this rides the breaking change the provider split already made instead of adding a second one later for a cosmetic reason. -
Access is granted on frontend models. A request naming one is authorised against it; naming a provider model directly still needs a grant on that model. The old rule required a grant on the resolved provider model, which pinned every grant to a provider model's name — so renaming one revoked access silently, as migration 0029 demonstrated. A grant on a frontend model covers the chain it routes to, so adding a target extends the reach of everyone holding it; editing one requires
config:write, which already grants everything. -
Declared context windows never reached routing.
Registrycarried acontext_lengthmap whose doc comment said it was filled from the snapshot, and nothing ever filled it — sorouting::candidates' context-window fallback, which demotes a model whose window provably cannot hold the request, could not fire in any production build. The column, the admin API field and the routing code were all present and correct; only the wiring between them was missing. -
The Kubernetes operator earns its keep. It was removed earlier in this cycle for reconciling two Deployments a chart already produces; it is back because the four things a chart genuinely cannot do are now implemented and verified against a live cluster:
- Ordered upgrades. The two planes share a database schema, so
spec.imagerolls the control plane first and holds the gateway at the image it is running until that has finished. Verified with a deliberately unpullable tag: the control plane went down, the gateway kept serving on the old image, and theUpgradingcondition said which and why. - Rotation that takes effect. Both pod templates carry a hash of the resolved Secret material, so rotating the proxy token — or cert-manager renewing the control-plane certificate — rolls the pods instead of silently doing nothing until an unrelated restart.
- Preflight. Every referenced Secret is resolved and checked before
anything is applied; a missing key or a short encryption key becomes a
condition naming the Secret and the key rather than pods in
CreateContainerConfigError.encryptionKeyis immutable, enforced by the API server through a CEL rule. - A finished install.
bootstraprunsset-passwordas a Job once the control plane is ready, so the deployment ends with a UI that can be signed into. Verified end to end:POST /loginreturns 200 and the admin API answers with the cookie, 401 without.
- Ordered upgrades. The two planes share a database schema, so
-
The management UI knows when an operator runs it. A Deployment screen — image, replicas, policy, timeouts, workers, pool size, autoscaling, plus phase, conditions and what is actually serving — that patches the
FastllmProxyand lets the operator roll it out. It appears only under an operator: the control plane learns it is managed from an environment variable only this controller sets, so a Helm or manifest install has no such screen andGET /admin/deploymentanswers 404. The control plane reaches the API server through its own ServiceAccount and a Role naming oneresourceName, withgetandpatchand nothing else.Plus the day-1 fields a real cluster cannot do without — Service annotations (a pinned load-balancer address), scheduling, ingress, HPA,
workers/poolMaxIdle, OTLP, a ServiceMonitor, andextraArgs/extraEnvas the escape hatch — and, for the operator itself, leader election over a Lease (so it runs two replicas rather than one), Kubernetes Events, and its own/metrics,/healthzand/readyz.
Removed
- Seven of the classifier benchmarks (
potion,potion-real,potion-classes,potion-arch,potion-wide,classcheck,wrapskew). They answered "which model, which classes, which token cap" once; the answers are indocs/classifier/measurements.md, which is the artefact worth keeping.bench/minilmstays — measuring a candidate model is a question that recurs. docs/superpowers/— pre-build design notes and task lists for work that shipped, unpublished by the book and already contradicted by the code (they describe a third snapshot source that does not exist).
Fixed
- Stability under load (audit of 2026-09-30). Each item is a mechanism
found by reading the code, fixed without a reproduction:
- A backend ejected by traffic (header timeouts, a frozen engine) is out
for 30s doubling to 5m, and neither a passing
/modelsprobe nor the fleet's vote can lift it early. A wedged engine answers/models, so the probe used to re-admit it at once and it cycled at the probe interval. It returns on probation: one more timeout and it is out again, for longer. - The stall detector needs 10s of frozen counters, not 4.
- Health probes run once per endpoint, not once per model behind it. A provider with ten models was probed ten times per interval per replica.
- The admission queue count no longer leaks when a client hangs up while
waiting, which used to shrink
max_queueduntil the gate refused everything. - An upstream body that goes silent for 5 minutes is abandoned instead of holding its slot forever.
- The listener sheds connections past 20,000, times out slow headers (30s)
and backs off on
accepterrors instead of spinning. - The disguised-error check (#28) reads at most 64 KiB and replays the rest.
- Peer forwarding uses the request's own path and has a timeout.
- Spend inside a 5% band is no longer a snapshot change, so a usage flush stops making every proxy rebuild routing and clear its cache.
- Usage batches the control plane could not take are retried (bounded) instead of dropped, and flushed on shutdown.
- A snapshot is applied only if its routing table builds: the table is built first, so a failure no longer leaves auth on the new policy and routing on the old one with no retry.
- A snapshot with the same policy under a new version replaces the stored one
without rebuilding the registry or clearing the cache.
content_eqnow also compares MCP servers, agents, prompt classes and the fallback model, which it used to ignore. - Snapshot builds that publish are serialised, so a slow periodic build can no longer store an older view of the database over a newer admin write.
- The provider sweep and the usage roll-up run on one control-plane replica at a time (a Postgres advisory lock), so a second replica is safe.
- Request bodies share a process-wide budget (
--max-inflight-body-mb, default 512); a request that cannot get its share in 5s is refused with 503. - Retries onto a sibling backend are capped at a fifth of recent requests (plus a floor of 10 per 10s). A slow backend used to push its whole load onto its siblings at the moment they could least take it. A request refused a retry gets what it already got; failover to the next model in a chain is not limited.
fastllm_backend_ejections_total, anddeploy/monitoring.yamlwith a ServiceMonitor and alerts for replica disagreement, flapping, no backends, dropped usage and upstream 5xx.- Readiness is
/readyz, failing only while draining, with--shutdown-delay(5s) of continued serving afterSIGTERM. It no longer tracks backends.
- A backend ejected by traffic (header timeouts, a frozen engine) is out
for 30s doubling to 5m, and neither a passing
- An upstream error sent with HTTP 200 is now returned with its real status
(#28). A non-streaming JSON
200whose body is{"error":…}(a gateway in front of NVIDIA, saturated) takes theerror.codeit declares, so clients retry, failover fires and error counters see it. Streams are never read. - A backend a probe ejected is the last resort, not a 502 (#29). When a
model's every backend is out of rotation and nothing is left in its chain,
the least-loaded one is tried anyway. The probe timeout is
--health-timeout(default 3s) and the header timeout--upstream-timeout(default 120s); both were already flags. POST /admin/modelssilently droppedcontext_length: the field was PATCH-only, so a caller who sent it at creation got 201 and a model with no context window. It is settable at creation now.- Every request struct in the admin API now rejects fields it does not
model. serde drops unknown fields by default, which is how the above went
unnoticed — and turning strictness on immediately found two more callers
sending
rolestoPOST /admin/principals, an endpoint that has never taken one. One of them passed["inference"]and believed it granted a role.
[0.2.0] — 2026-08-14
Two new gateways — tool servers and agents — behind the same keys, the same grants and the same accounting as models. Plus three importer bugs found by running it against a real database rather than trusting the tests.
Published as ghcr.io/azrtydxb/fastllm-proxy:v0.2.0 and
ghcr.io/azrtydxb/fastllm-operator:v0.2.0, linux/amd64 and linux/arm64.
Each architecture is built on a runner that is that architecture and the two
digests are merged into one manifest — the first attempt emulated amd64 with
QEMU and rustc segfaulted before compiling anything.
Added
- MCP gateway. One endpoint in front of every tool server, with the same
keys and the same grant machinery as models. A server is a row; a grant is
mcp:invokeonmcp/<name>and is deliberately not implied bymodel:invoke, because tools have side effects and models do not. Tools arrive namespaced<server>__<tool>so two servers can both exposesearch.GET /v1/mcp/servers,POST /v1/mcp/tools/list,POST /v1/mcp/tools/call, an MCP servers screen, and admin CRUD under/admin/mcp-servers.stdioservers are deliberately unsupported — see docs/mcp.md. - A2A gateway. One address in front of every agent:
GET /v1/agents, the agent card at/v1/agents/{name}/.well-known/…rewritten to point at this gateway so the client's next call is still authorised and attributed, andPOST /v1/agents/{name}carrying every JSON-RPC method. Protocol versions are pinned per agent rather than inferred, forwarded methods are a closed list, andagent:invokeis implied by neithermodel:invokenormcp:invoke. An Agents screen and/admin/a2a-agentsCRUD. Translation between 0.3 and 1.0 is deliberately not built — see docs/agents.md. - Interactive API reference on the docs site, rendering the same
openapi.jsonthe control plane serves at/openapi.json.
Fixed
importdropped four backend fields it had already parsed.protocol,auth_header,auth_schemeanddefault_max_tokensare declared in the config schema so a YAML file can describe an Anthropic or Azure backend, andRegistry::buildhonours them — butimportwrote three columns, so the same file produced anopenaibackend onBearerauth once it reached the database. Nothing warned: every dropped field has a valid default. Anyone who imported a native-protocol backend should re-runimport, which now converges an existing row instead of only avoiding a duplicate.- The
FileSourcepath dropped the same four, so one YAML file described a different backend depending on which code path read it. auth_schemewas two states where it needed three. Absent meansAuthorization: Bearer <key>;""means send the key with no prefix, which is what Azure'sapi-keyand Anthropic'sx-api-keyrequire. Treating absent and empty alike strippedBearerfrom every File-mode backend that did not mention the field — a request every OpenAI-compatible upstream rejects. Found by running an import against a real database and reading the row.importdropped thelimits:andbudget:blocks fromauth.keysentirely, so a key imported out of a rate-limitedFile-mode deployment arrived in the database unlimited. The key worked, which is why nobody would have looked.- A LiteLLM
anthropic/-style prefix was never stripped, soanthropic/claude-sonnet-4reached Anthropic as a model by that name. It is now stripped only when the backend speaks that protocol: to OpenRouter the same string is the model id and stripping it would ask for a model that does not exist.openrouter/joins the transport prefixes, and exactly one prefix is ever removed, soopenrouter/anthropic/claude-sonnet-4becomes the OpenRouter idanthropic/claude-sonnet-4.
[0.1.0] — 2026-08-13
First tagged release. Everything below was built before it, so this entry is a description of what 0.1.0 is rather than a diff against something earlier — grouped by capability, because there is no previous version to compare against.
Published as ghcr.io/azrtydxb/fastllm-proxy:v0.1.0 (linux/arm64).
Gateway and request path
- OpenAI-compatible gateway over any number of backends, with responses
forwarded byte-for-byte: an
openaibackend's body is never deserialised, re-encoded or buffered. - Twelve proxied
POSTendpoints:/chat/completions,/completions,/responses,/embeddings,/rerank,/score,/audio/{transcriptions,translations,speech},/images/{generations,edits}and/moderations. - Cache-affinity routing with a load escape hatch — a shared prefix returns to
the node holding its KV cache unless that node is meaningfully hotter than the
least-loaded one.
least-loadedandround-robinare selectable alternatives. - The request path performs no I/O, enforced by
tests/no_io_on_hot_path.rs. - Owned upstream connections rather than a pooled client, after the pooled one was measured as the cause of a 6× throughput difference.
- Graceful shutdown: SIGTERM stops accepting, lets in-flight generations finish
up to
--shutdown-grace(25s), and logs anything still open when it expires.
Routing
- Virtual models: ordered rules, weighted and ordered targets, and a failover chain across models, not just replicas.
- Rule conditions on principal, role, prompt and generation length, streaming, request headers, budget consumption, per-backend in-flight count, and time of day with weekday and UTC offset.
- Two-tier semantic routing — a ~115 µs static-embedding tier and an optional int8 ONNX transformer that only loads when a rule names a refined class.
POST /admin/routing/dry-runanswers which rule decided and what the chain resolved to, without dispatching anything.- A deployment-wide fallback model appended to every chain, authorised like any other candidate so it can never widen a caller's reach.
Providers and protocols
- 42 providers reachable as configuration; 40 speak the OpenAI API, 2 are translated.
- Native Anthropic (Messages) and Gemini (
generateContent) translation in both directions, including streaming, tool calls, and image and audio inputs. - Per-backend
protocol,auth_header,auth_schemeanddefault_max_tokens— reachable from both the control plane and a YAML file, which is what makes Azure OpenAI (api-keywith noBearerprefix) and native backends configurable without the database. - GCP service-account credentials minted and refreshed for Vertex AI.
Control plane, RBAC and accounting
- Control plane / data plane split behind
--role, sharing a pre-flattened snapshot;AppState::apply_snapshotis the single write path. - RBAC with real API keys: principals, roles, permissions, per-model
model:invokegrants. Keys hashed with SHA-256, passwords with Argon2id. - Upstream credentials encrypted at rest with AES-256-GCM.
- Per-principal rate limits with cross-replica reconciliation, token and spend
budgets over fixed windows, and
x-ratelimit-*response headers. - Usage accounting folded from a bounded tail buffer parsed once at end of stream; costs in integer micro-units, with prices synced from published catalogues and a provider-reported cost taking precedence.
- Append-only audit log recorded by a layer over every mutating route, with keyset pagination.
- Exact-match response cache, opt-in per model, bounded by both entries and bytes and dropped whole on any snapshot change.
Operations
- Embedded React admin UI — thirteen screens covering fleet, backends, models, routing, classes, keys, RBAC, limits, usage, audit and settings.
- Per-replica health reports over the existing proxy-token channel, surfaced by
GET /admin/fleet; kept per replica and never merged, so a partition and a dead backend stay distinguishable. - Prometheus metrics including latency histograms, cache counters and the
snapshot version, plus optional OTLP tracing behind the
otelfeature. - Reload in place: SIGHUP or a snapshot poll swaps the routing table atomically without disturbing in-flight generations.
- Runs as one binary in three shapes (
all,control,proxy); Kubernetes manifests indeploy/.
Accounting, history and the UI
- Usage recorded for every attributable request, not only for principals under a budget or a token limit — the narrower rule meant a deployment that enforced nothing recorded nothing.
- Refusals the gateway makes itself (403/429/402, and the 502 for an unreachable chain) recorded and tagged by kind, so a total backend outage no longer writes zero rows and reads as a quiet period. Unattributable refusals (401, unknown model) counted per replica per minute instead of rowed, since 401 is the one refusal a stranger can trigger at will.
GET /admin/timeseriesserves that history bucketed, with empty buckets as explicit zeros and null latency where there was nothing to measure.- 90 days of per-request rows, then hourly rollups kept indefinitely. Rollups carry no percentiles, because percentiles do not merge.
- Charts on Overview and Metrics with a click-through drill-down: five ranges, pan through history, filter by model or principal.
- Model
context_length, and a routing rule that demotes a model which cannot hold the prompt plus the requested generation. Undeclared is never treated as too small. --policy lowest-latencyfor pools whose members are not equivalent.--webhook-urlfor backend up/down and snapshot-rebuild failure, HMAC-signed./v1/modelsfiltered to what the calling key may actually invoke.
Documentation and packaging
openapi.json, served at/openapi.jsonwith Swagger UI at/docs, checked against the router in both directions bytests/openapi.rs.- A Helm chart for deployments that are not this cluster.
- Client integration guide (SDKs, five coding agents, four frameworks) and a troubleshooting page seeded from failures that actually happened.
- A Grafana dashboard and a signature-verifying webhook receiver in
examples/.
Testing
tests/protocol_fuzz.rs— mutation fuzzing over the Anthropic and Gemini translators, asserting no input panics, including arbitrary SSE chunk boundaries.tests/doc_claims.rs— countable claims in the README checked against the tables they count.web/test/— every screen mounted against wire-format fixtures, every control clicked, and the request each mutation sends asserted against the handler that receives it.- Benchmarks against LiteLLM, with the conditions and the unfavourable results
recorded alongside the favourable ones in
docs/performance.md.